. 2022 Jan 3;13(6):1641–1647. doi: 10.1039/d1sc06366a

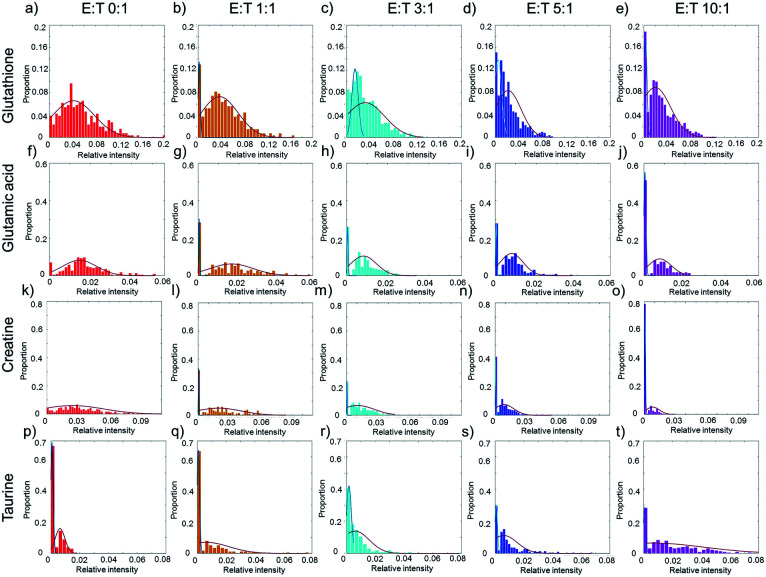
Fig. 4. The heterogeneity of the response of HepG2 cells induced by NK cells. (a)–(e) The distribution of glutathione with different ratios of E : T. (f)–(j) The distribution of glutamic acid with different ratios of E : T. (k)–(o) The distribution of creatine with different ratios of E : T. (p)–(t) The distribution of taurine with different ratios of E : T. The red curves in (a), (f), and (k) show the metabolic heterogeneity in HepG2 cells without co-culturing with NK cells. In (b)–(e), (g)–(j), and (i)–(o), the cells are divided into two phenotypes according to the relative intensity of specific metabolites. The blue curves represent the cells of low relative intensity and may be in the stage of late apoptosis, and the red curves represent the cells of high relative intensity and may be in the stage of early apoptosis. In (p)–(t) the blue curves represent the cells in low relative intensity of taurine, while red curves represent the cells in high relative intensity.

Fig. 4