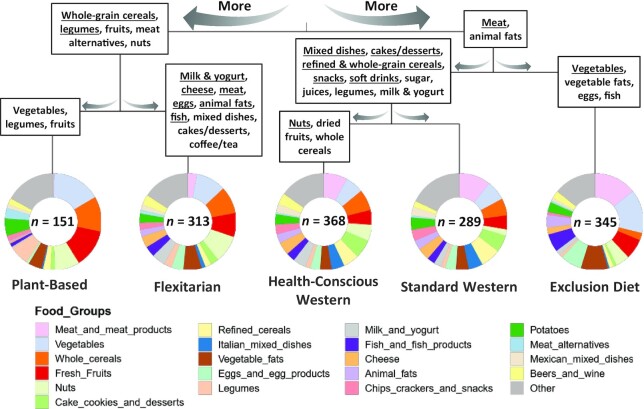
FIGURE 2.
Contribution of food groups to DP5 patterns. Pie charts represent Dirichlet scaled contributions of food groups for each dietary pattern. Food groups are ordered by their contribution to the clustering. Patterns are grouped together using a hierarchical ascending clustering on standardized data. Food groups were mentioned in each branch if their Dirichlet contribution was higher in all left/right patterns compared with right/left patterns and if their Cliff's Delta effect size was medium (≥0.33; bold) or large (≥0.47; bold underlined). Cliff's Delta effect sizes were computed based on individual relative kcal intakes. n is the size of the pattern. Abbreviations: DP5, 5 dietary patterns.

