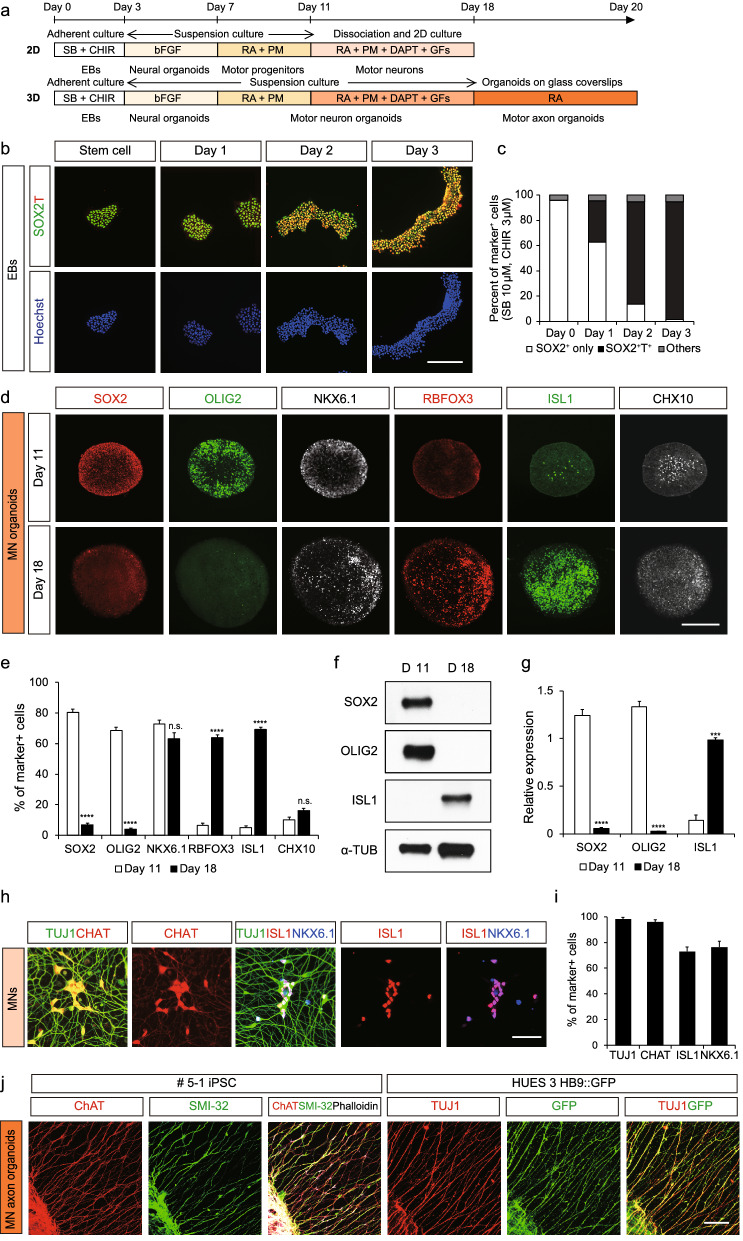
Figure 1.
Generation and characterization of motor nerve organoids. (a) Schematic of the protocol used to generate dissociated motor neurons and motor nerve organoids. (b,c) Representatives and quantification of SOX2+, T+, and SOX2+T+ cells in organoids attached on the 2D planar surface (n > 9 images per day). (d) Images of D11 and D18 organoids immunostained with SOX2, OLIG2, NKX6.1, RBFOX3, ISL1, and CHX10 antibodies. (e) Quantification of the percentage of marker-expressing cells among the total number of cells stained with Hoechst dye (n > 9 organoids per group). (f) Western blot analysis showing the expression of SOX2, OLIG2, ISL1, and α-tubulin in motor nerve organoids. α-tubulin was used as a loading control. (g) Quantification of western blot band intensities (n = 3 experiments). (h,i) Images and quantification of D18 dissociated motor neurons with neuronal marker TUJ1, motor axonal marker CHAT, and motor neuronal markers ISL1 and NKX6.1 immunoreactivity (n > 3 images per condition). (j) Representative images of axons of D18 organoids derived from 5-1 iPSC and HUES 03 HB9::GFP ESCs. Organoids were labeled with motor axon markers CHAT and SMI-32, axonal marker TUJ1, GFP or phalloidin for F-actin as indicated (n = 6 organoids per group). Error bars represent s.e.m.; ***p < 0.001; ****p < 0.0001; n.s., not significant versus Day 11; n.s., not significant; unpaired Student’s t-test. Scale bars 20 μm in (b), 200 μm in (d), 50 μm in (h), 100 μm (left panel) and 250 μm (right panel) in (j).

