Figure 2.
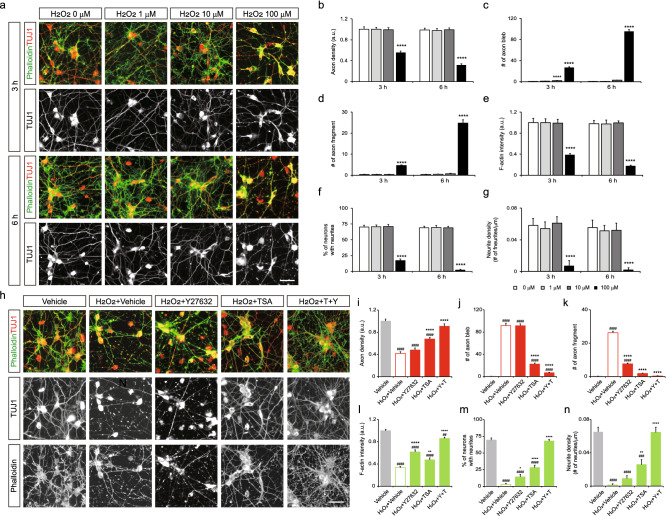
Oxidative stress-driven motor neuronal death and axon degeneration. (a) Images of dissociated motor neurons exposed to 1–100 μM of H2O2 for 3 and 6 h, stained with phalloidin and immunostained with TUJ1 antibody. (b–g) Measurement of axon density, the number of axonal blebs and fragments, F-actin fluorescence intensity, % of neurons with neurites, neurite density per field (n = 24–36 images per condition). Error bars represent s.e.m.; ****p < 0.0001 versus 0 μM at 3 h or 6 h; one-way ANOVA test with Tukey’s test. (h) Images of motor neurons treated with 100 μM of H2O2 and drugs for 6 h. (i–n) Quantification of axon density, the number of axonal blebs and fragments, F-actin fluorescence intensity, % of neurons with neurites, neurite density per field (n = 27 images per condition). Error bars represent s.e.m.; ##p < 0.01, ###p < 0.001, ####p < 0.0001 versus Vehicle; *p < 0.05, **p < 0.01, ****p < 0.0001 versus H2O2 + Vehicle, one-way ANOVA test with Tukey’s test. Scale bars 10 μm.

