Figure 3.
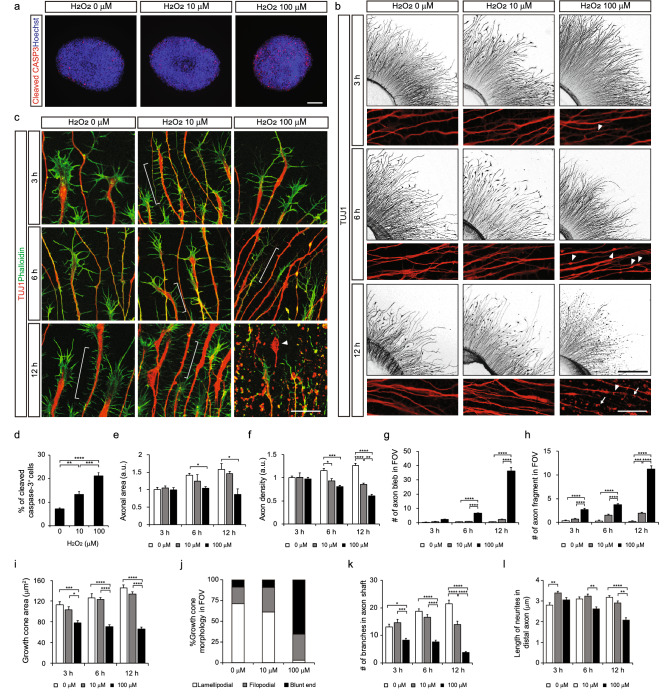
Oxidative stress–induced axon degeneration in motor nerve organoids. (a) Representative immunofluorescence images and quantification of organoids treated with H2O2 for 6 h, stained with apoptosis marker cleaved-CASP3 antibody and Hoechst. Scale bar 100 μm. (b) Motor nerve organoids exposed to 10 and 100 μM of H2O2 for 3, 6, and 12 h, and immunostained with TUJ1 antibody. Arrowheads indicate axon blebs and arrows indicate severed axon fragments. Scale bars 250 μm (upper panels) and 50 μm (lower panels). (c) Representative images of growth cones under the oxidative stress in motor axon model, immunostained with TUJ1 antibody and phalloidin. Note that retraction bulb-like deteriorating axon structure (arrowhead) and dramatic reduction of neurites along the axon shaft (compare brackets) in 100 μM of H2O2–treated group. Scale bar 50 μm. (d) Quantification of the percentage of cleaved CASP3+ cells among the total number of cells stained with Hoechst dye (n = 9–27 images per condition). (e–h) Quantification of axonal area per organoid (e) (n = 3–16 organoids per condition), axon density per field (f) (n = 29–61 images per condition), the number of axon blebs (g) (n = 24–36 images per condition), and the number of fragments per field (h) (n = 19–33 images per condition). (i) Measurement of growth cone area at various time points. (n > 120 growth cones per condition). (j) The growth cones at 6 hours were categorized into three types: lamellipodial, filopodial, and blunt growth cones. (n = 91–120 growth cones per group). (k, l) The number and average length of neurites in axon shafts (< 100 μm from the axon tip) were reduced by H2O2 treatment (n = 12 axons per condition in k, and n = 44–257 neurites per condition in l). Error bars represent s.e.m.; *p < 0.05, **p < 0.01, ***p < 0.001, ****p < 0.0001; one-way ANOVA test with Tukey’s test.

