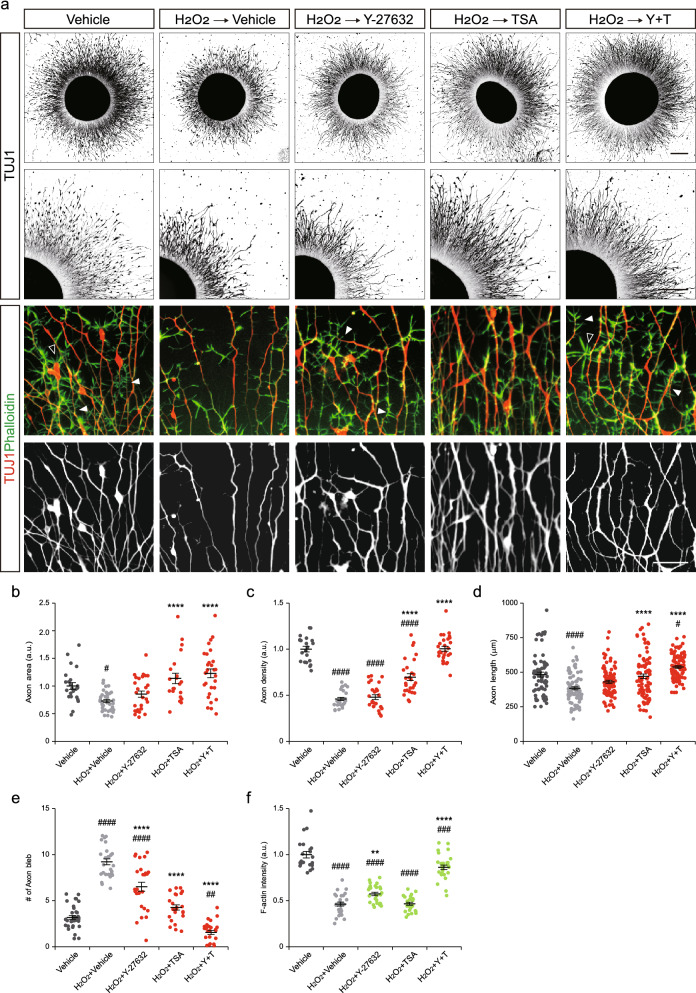
Figure 4.
Pharmacological intervention of cytoskeletal dynamics after oxidative stress suppresses axon degeneration. (a) Representative images of motor nerve organoids treated with Y-27632 (10 μM) and TSA (10 μM) for 12 h after 100 μM of H2O2 for 6 h. Lower-panel images show high-magnification views of the upper-panel images. Some fine protrusions at the axon shaft (closed arrowheads) and radially projected filopodial structures (open arrowheads) were marked. Scale bars 250 μm (upper and middle panels), and 30 μm (lower panels). (b–f) Axonal area (b) (n = 24–38 organoids per condition), density (c) (n = 21–28 images per condition), length (d) (n = 70–90 axons per condition), the number of axon blebs (e) (n = 26–37 images per condition), actin fluorescence intensity (f) (n = 22–30 images per condition) in drug-treated organoids. Error bars represent s.e.m.; #p < 0.05, ##p < 0.01, ###p < 0.001, ####p < 0.0001 versus Vehicle; **p < 0.01, ****p < 0.0001 versus H2O2 + Vehicle, one-way ANOVA test with Tukey’s test.

