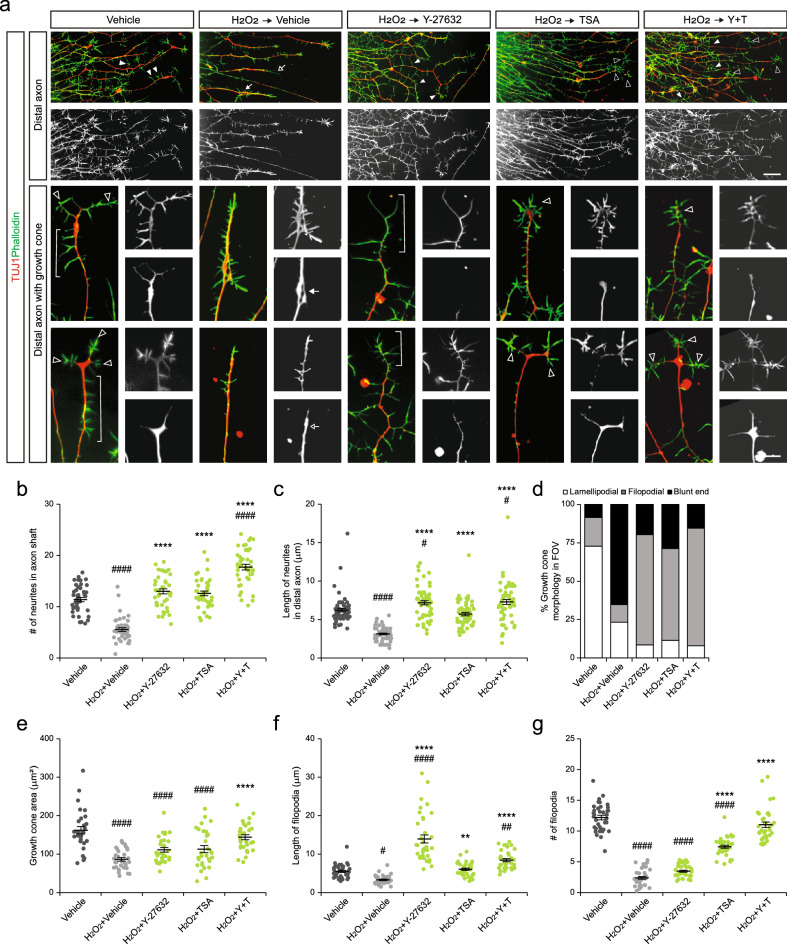
Figure 5.
Assessment of regenerating growth cones after cytoskeletal drug treatment. (a) Representative images of distal axons and growth cones at the axon tips treated with cytoskeletal drugs. Note short neurites at the axon shaft (closed arrowheads) and diverse morphology of growth cones developing radially projecting filopodia (open arrowheads), elongated filopodia (brackets), disorganized and entangled microtubule network (arrow), or collapsed growth cone (open arrow). (b,c) The number and length of neurites at the axon shaft (n = 42 axons per condition in b, and n = 60 neurites per condition in c). (d) Bar graph illustrating the ratio of growth cones with different morphology (n = 61–78 growth cones per condition). (e–g) The area of the growth cone (e) and the number (f) and average length (g) of neurites in distal axons (< 100 μm from the axon tip) (n = 30 growth cones per condition in e, n = 36 neurites per condition in f and g). Error bars represent s.e.m.; #p < 0.05, ##p < 0.01, ####p < 0.0001 versus Vehicle; **p < 0.01, ****p < 0.0001 versus H2O2 + Vehicle, one-way ANOVA test with Tukey’s test. Scale bars 20 μm (upper panels), 5 μm (lower panels).

