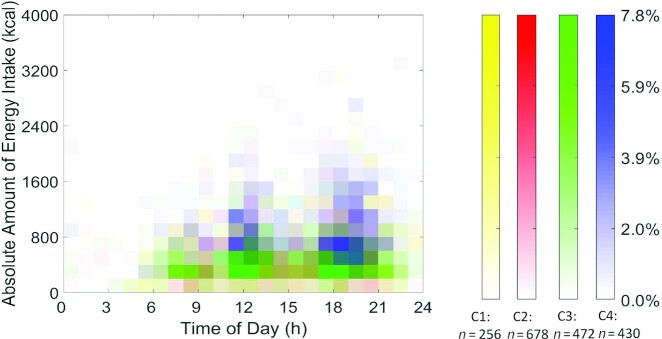
FIGURE 3.
The largest EI heat maps representing 4 distinct JTDPAPs for US adults aged 20–65 y drawn from NHANES 2003–2006. Heat maps (distribution) of the highest EI of 1836 participants in 4 JTDPAP clusters (C1: n = 256; C2: n = 678; C3: n = 472; C4: n = 430). The clusters were generated through the dependent constrained band dynamic time warping method for nonpregnant US adults aged 20–65 y as drawn from NHANES 2003–2006. The absolute EI (blocks in heat map) is characterized by amount (y axis: ranging from 0 to 4000 kcal) ranging from 00:00 to 24:00 at the hourly level (x axis). The shading of blocks (ranging from 0.0% to 7.8%) represents the proportion of participants in each cluster whose highest EI is characterized by the corresponding amount and timing. Darker shading represents a greater percentage of participants in the cluster reporting the same amount of EI at that time. C1, Cluster 1; C2, Cluster 2; C3, Cluster 3; C4, Cluster 4; EI, energy intake; JTDPAP, joint temporal dietary and physical activity pattern.

