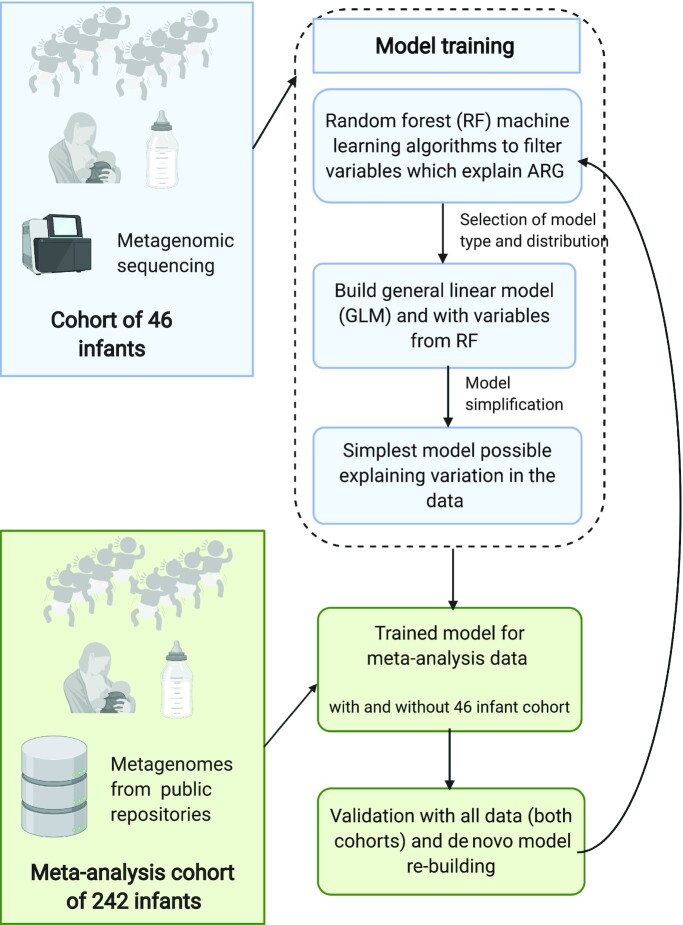
FIGURE 2.
Flowchart of analysis methods, describing the included cohorts and the statistical analysis pipeline devised for this study. The pipeline was used to ensure that the effect of diet could be validated in several points of the analysis and that suitable distributions and model types are applied to the data. Blue boxes describe steps in preliminary analysis with the training set of 46 infants, and green boxes steps taken in model testing and cross-validation with meta-analysis cohorts. Abbreviations: ARG, antibiotic resistance gene.

