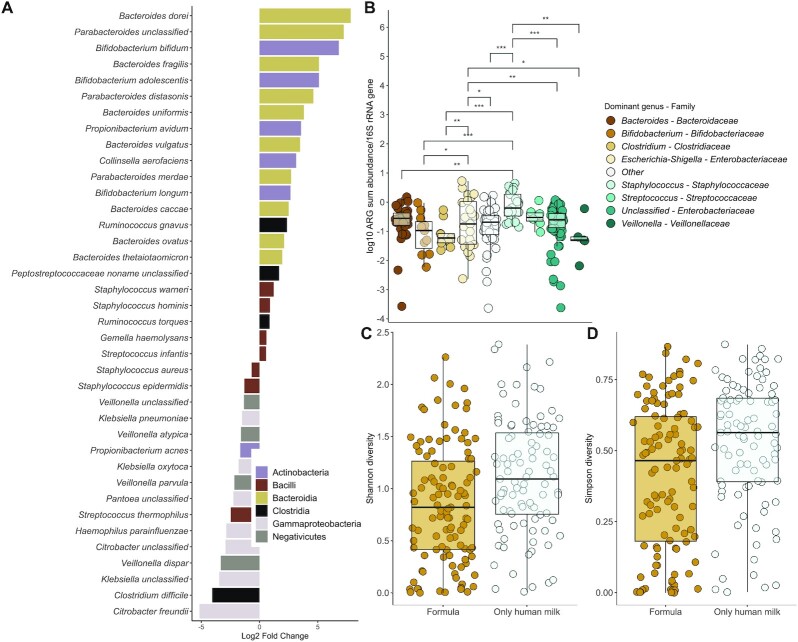
FIGURE 5.
Microbial community changes linked to ARG abundances in the meta-analysis cohorts. (A) Species enriched or depleted in formula-fed neonates. Negative/positive values reflect significant enrichment/depletion in formula-fed neonates using DESeq2 analysis. Species with negative values are enriched in formula-fed infants, and species with positive values are depleted in infants fed formula, with an adjusted P value cutoff of 0.05 for reported species. (B) Relative ARG abundances in neonates whose guts are dominated by different genera. Significance levels are denoted as follows: *** = 0–0.001; ** = 0.001–0.01; * = 0.01–0.05. Staphylococcus-dominant infants had the highest relative abundances of ARGs (gamma distributed GLM: n = 242, adjusted P < 0.05; Supplemental Data 6). (C) Shannon and (D) Simpson (1—D) diversity indexes by formula consumption in neonates. Infants fed formula had significantly lower microbial community diversity than infants exclusively fed human milk gamma-distributed GLMs [n = 242; Shannon: 0.81 (95% CI: 0.68–0.96); Simpson: fold change, 0.81 (95% CI: 0.69–0.96); P = 0.01]. (B–D) The boxplot hinges represent 25% and 75% quantiles, and the centerline shows the median. Notches are calculated with the formula median ± 1.58 × IQR/sqrt (n). Abbreviations: ARG, antibiotic resistance gene; GLM, generalized linear mode.

