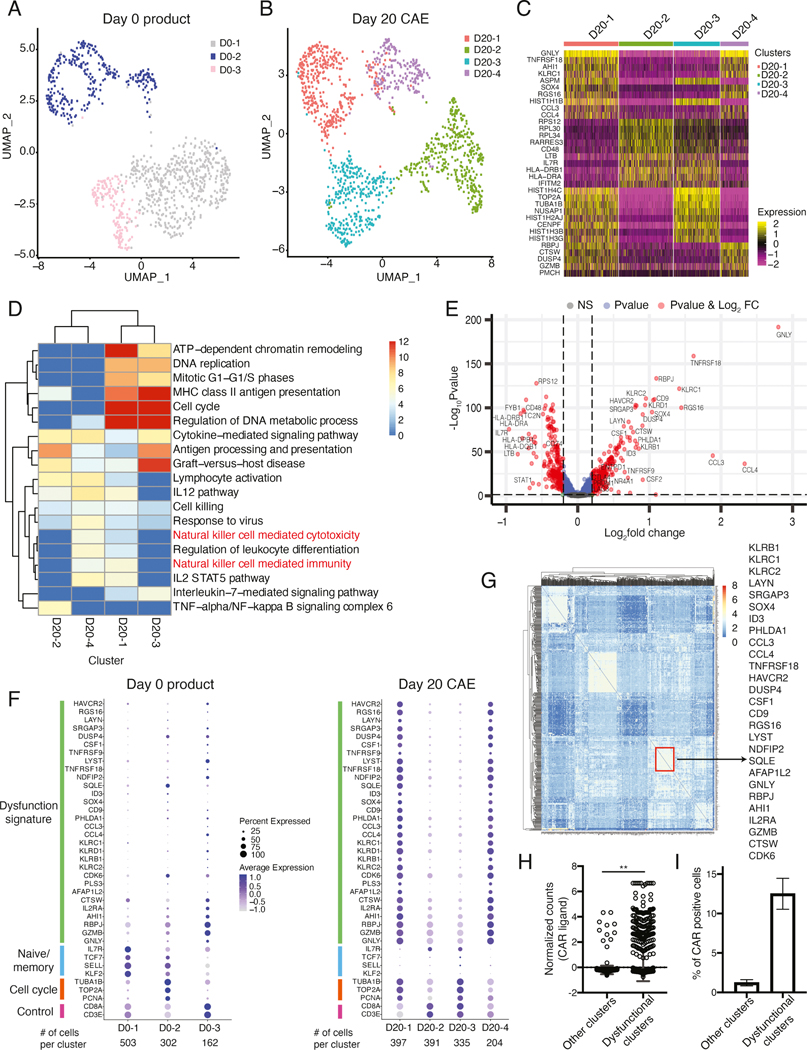
Figure 3: Single-cell analysis of CAE CD8+ T cells reveals co-expression of dysfunction signature genes.
UMAP projection of sc-RNA seq data from day 0 product (A) and day 20 CAE cells (B) for donor ND388. (C) Heatmap of top 10 marker genes for each cluster defined in B. (D) Gene ontology determined by metascape pathway analysis for each single-cell cluster from the day 20 CAE sample. Columns are cell clusters (from B) and rows are enriched pathways color coded by level of significance. (E) Volcano plot depicting differentially expressed genes between day 20 CAE clusters 1 and 4 (dysfunctional) and clusters 2 and 3 (non-dysfunctional). Genes upregulated in the dysfunctional clusters are on the right side. Red dots indicate significant genes with p<0.05 and log2FC >0.2. (F) Dot plot illustrating the expression level of dysfunction signature, naïve/memory, cell cycle and control genes in day 0 (left) and day 20 CAE (right), donor ND388. Each column represents one cluster as depicted in A and B. (G) Gene regulatory network analysis (PIDC) for day 20 CAE cells. Columns and rows are the top 500 most variable genes determined by Seurat. Depicted on the right are select genes found within the same community, boxed in red. (H) Normalized counts of CAR transcripts from sc-RNA-seq data for day 20 and 28 CAE cells. Pooled cells from dysfunctional and non-dysfunctional clusters from three CAR T donors. Data shown as mean with standard deviation. Significance by Mann-Whitney U test. (I) Percent of cells that express the CAR transcript in dysfunctional and non-dysfunctional clusters. Average of three CAR T donors. Data shown as mean ±SEM. See also Figures S4, S5, and Tables S4 and S5.

