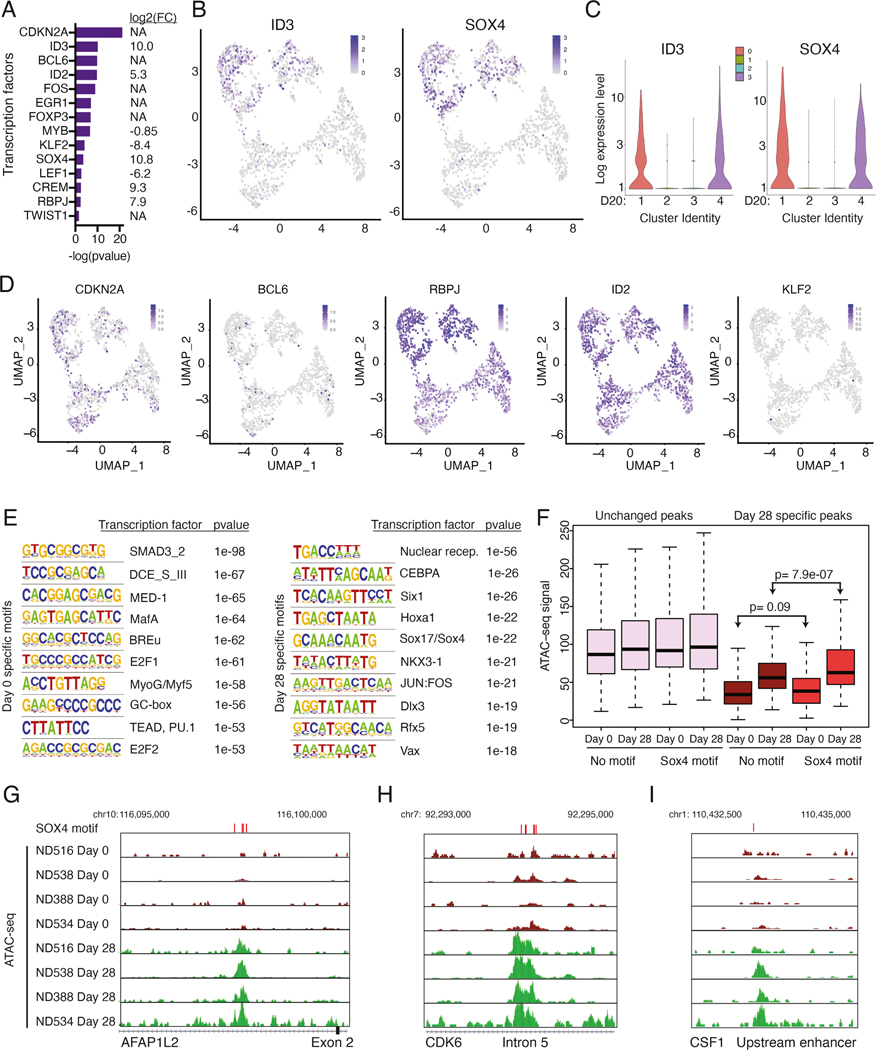
Figure 6: ID3 and SOX4 are potential regulators of the dysfunction signature.
(A) Select transcription factors predicted to regulate differentially expressed genes between day 0 and day 20 CAE cells in single-cell sequencing datasets, identified using IPA upstream regulator analysis. Depicted are transcription factors that overlap with factors from Figure 2F. On right, gene expression log2 FC (day 20 CAE/day 0) for each transcription factor. NA depicts genes that are not differentially expressed between day 0 and day 20 cells. (B) UMAP plots from Figure 3B showing single-cell transcript levels of ID3 and SOX4 on day 20 CAE cells. Top two clusters are dysfunctional. (C) Violin plots depicting gene expression levels for ID3 and SOX4 for each cluster from day 20 CAE cells (see Figure 3B). (D) Single-cell transcript levels of CDKN2A, BCL6, RBPJ, ID2, and KLF2 illustrated by UMAP plots, corresponding to clusters from Figure 3B (day 20 CAE cells). (E) HOMER motif analysis depicting top 10 enriched transcription factor motifs in bulk ATAC-seq dataset for day 0 samples (left) and day 28 samples (right). Analysis includes four biological replicates. (F) Box plots illustrating the ATAC-seq signal at unchanged peaks (left) and peaks that change between day 0 and day 28 (right). Data are further subdivided depending on whether a SOX4 motif is present. Statistics assessed by Mann-Whitney U test. (G-I) ATAC-seq tracks in regulatory regions at SOX4 motifs from day 0 and 28 CAE samples at dysfunction genes AFAP1L2 (G), CDK6 (H) and CSF1 (I). SOX4 motifs labeled with red bars above tracks. Analysis includes four biological replicates. See also Figures S6 and S7, Table S6.

