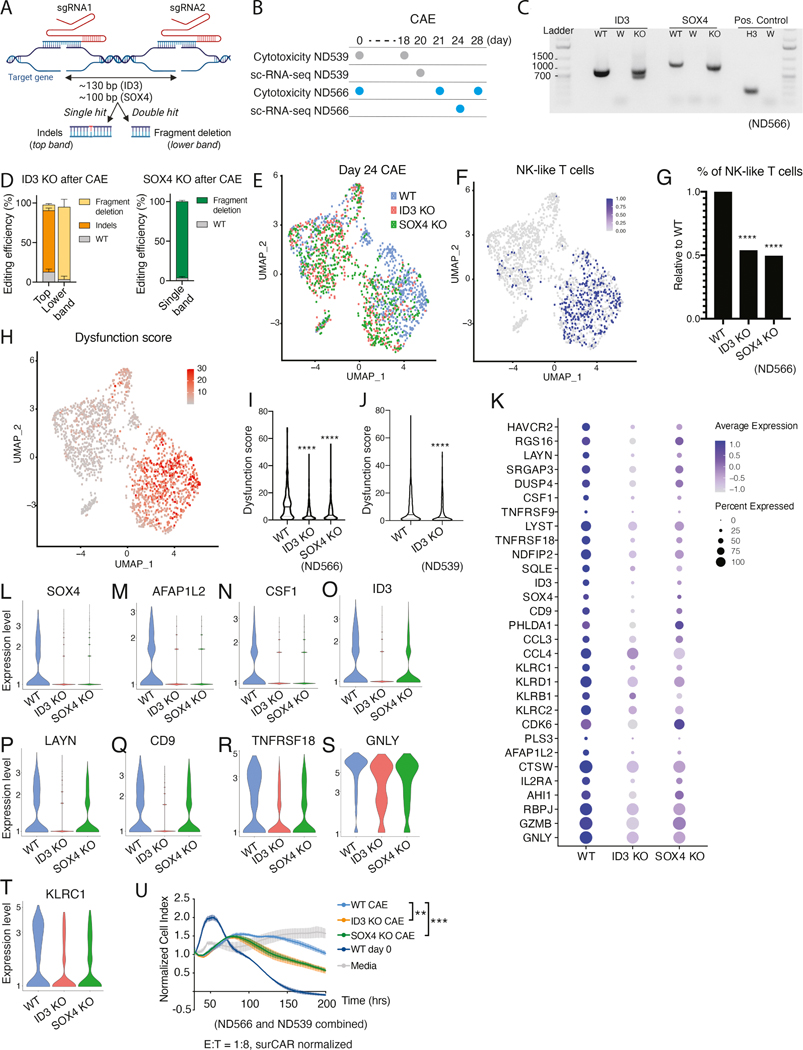
Figure 7: Disruption of ID3 and SOX4 improves CAR T effector function.
(A) Schematic representation of the CRISPR strategy to generate ID3 and SOX4 KO M5CAR T cells. (B) Experimental design for WT, ID3 KO, and SOX4 KO analyses for donors ND566 and ND539. (C) Agarose gel showing ID3 and SOX4 KO detection on cDNA from CD8 sorted populations after CAE for donor ND566. ID3: ID3 PCR, SOX4: SOX4 PCR, Positive Control: histone H3.3, WT: Mock M5CAR, W: water negative control, KO: ID3 KO (in ID3 PCR) and SOX4 KO (in SOX4 PCR). (D) KO quantification of ID3 (ND566 and ND539) and SOX4 (ND566) by cDNA sequencing. Percent indels and fragment deletions upon CAE are shown as mean with standard deviation. (E) UMAP projection of sc-RNA seq data from sorted CD8+ WT, ID3 KO, or SOX4 KO day 24 CAE cells for donor ND566-cells are color coded by KO status. (F) NK-like T cell population at day 24 CAE for donor ND566, depicted by co-expression of CD3, KLRB1, and KLRC1, overlayed on UMAP graphs from Figure 7E. (G) Percentage of NK-like T cells in WT, ID3 KO and SOX4 KO cells, relative to WT (donor ND566). Significance by Fisher’s exact test. (H) UMAP graph from Figure 7E with cells labeled according to expression of the dysfunction gene signature for donor ND566. Dysfunction score for WT, ID3 KO, and SOX4 KO cells for donor ND566 (I) and WT and ID3 KO cells for donor ND539 (J). Significance measured by Mann-Whitney U test. (K) Dot plot illustrating the expression level of dysfunction signature genes in WT, ID3 KO, and SOX4 KO day 24 CAE cells, donor ND566. (L-T) Violin plots depicting gene expression levels from WT, ID3 KO, and SOX4 KO day 24 CAE cells for SOX4 (L), AFAP1L2 (M), CSF1 (N), ID3 (O), LAYN (P), CD9 (Q), TNFRSF18 (R), GNLY (S) and KLRC1 (T) for donor ND566. (U) Cell killing capacity of WT, ID3 KO, and SOX4 KO M5CAR T CAE cells, with controls media alone and day 0 CAR T product. Cells were collected and seeded at 1:8 E:T ratio with AsPC-1 on day 18 (ND539) and day 21 (ND566). Data is presented as mean ± SEM. Significance by two-way ANOVA with Geisser-Greenhouse correction and Dunnet’s post hoc test. See also Figure S7.

