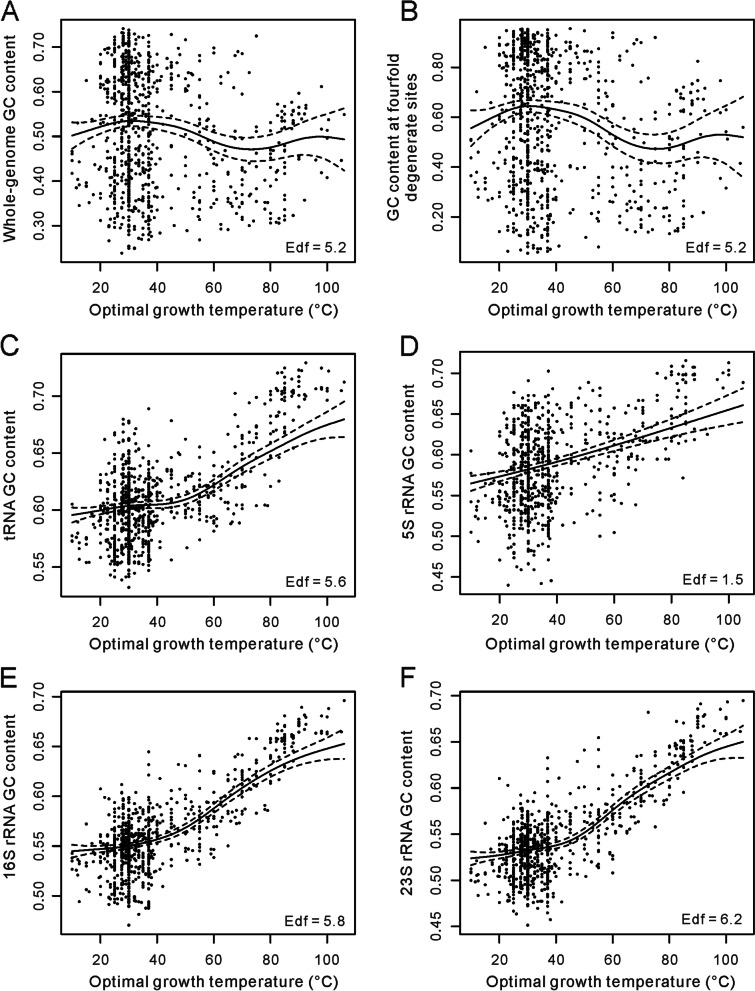
Fig. 4.
Nonlinearity in the relationship between prokaryotic optimal growth temperature and GC contents. It was estimated using the generalized additive mixed model (GAMM) by adjusting the genus as a random effect. The dataset including 836 prokaryotes (681 bacteria and 155 archaea) was used in this analysis. The 5S rRNA genes were not annotated in 60 genomes, so the analysis of the 5S rRNA has a sample size of 776. The effective degrees of freedom (edf) proxy for nonlinearity in the relationships. We presented the relationships of optimal growth temperature with the GC contents of the whole genome, fourfold degenerate sites, tRNA, 5S rRNA, 16S rRNA, and 23S rRNA as (A), (B), (C), (D), (E), and (F) in this figure and those of the protein-coding sequences and the non-coding DNA were deposited in Additional file 3: Fig. S1. The significance values of the results presented in (A) ~ (E) are P = 10− 4, 8 × 10− 7, 2 × 10− 16, 2 × 10− 16, 2 × 10− 16, and 2 × 10− 16, respectively

