Fig. 2.
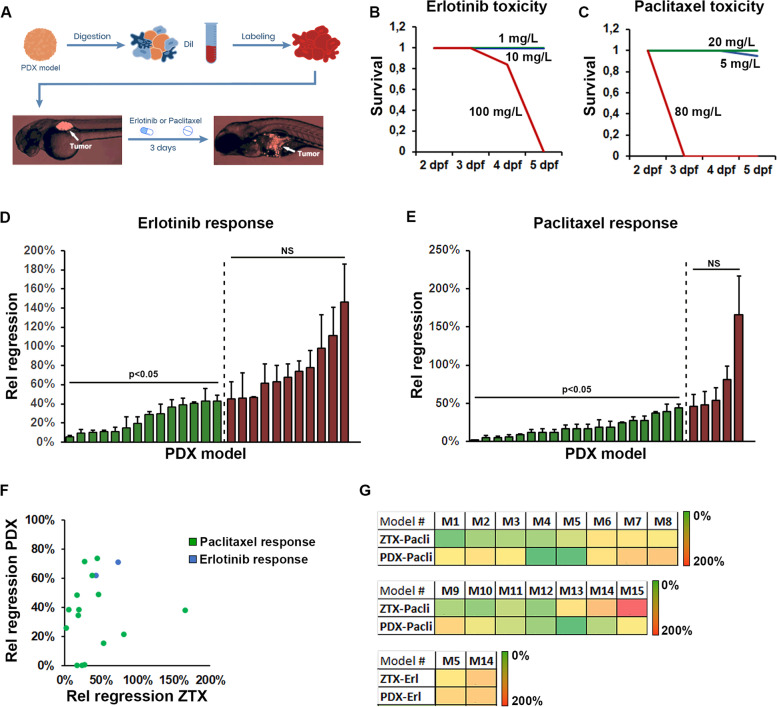
Similar response to erlotinib and paclitaxel are seen in ZTX and mouse PDX models. A Cartoon illustrating the tissue handling, implantation, and visualization of tissue fragments from mouse PDX material into zebrafish larvae followed by 3-days treatment with Erlotinib or Paclitaxel added to the water. B-C Quantification of the proportion of surviving embryos following treatment starting at 2-days post fertilization with the indicated concentrations of Erlotinib (B) or Paclitaxel (C) for one, two or three days. n = 20 (B) and n = 18 (C) per group. Blue lines indicate 1 and 5 mg/L, green lines indicate 10 and 20 mg/L and red lines indicate 100 and 80 mg/L in B and C respectively. D-E Quantification of the changes in tumor size between day three and zero for larvae treated with either Erlotinib, 10 mg/L (D) or Paclitaxel, 20 mg/L (E), divided by the changes in tumor size between day three and zero for larvae in the corresponding control groups (Rel regression) for each of the 25 models tested. Models where treatment led to significant tumor regression are shown in green whereas models where the drug did not significantly induced regression is shown in red. n = 7–22 per group, NS: non-significant. F Quantification and correlation of the treatment outcome for Erlotinib (blue dots) or Paclitaxel (green dots) plotted as relative treatment-induced regression in mouse-PDX models against that of the relative treatment-induced regression in the corresponding ZTX models. G Heat map of the degree of relative regression as quantified in D and E and shown in F for zebrafish tumor xenograft (ZTX) models and in a similar manner when PDX models grew in mice PDX, for each of the 15 models in which drug efficacy was tested in both zebrafish and mice. Erl: Erlotinib, Pacli: Paclitaxel

