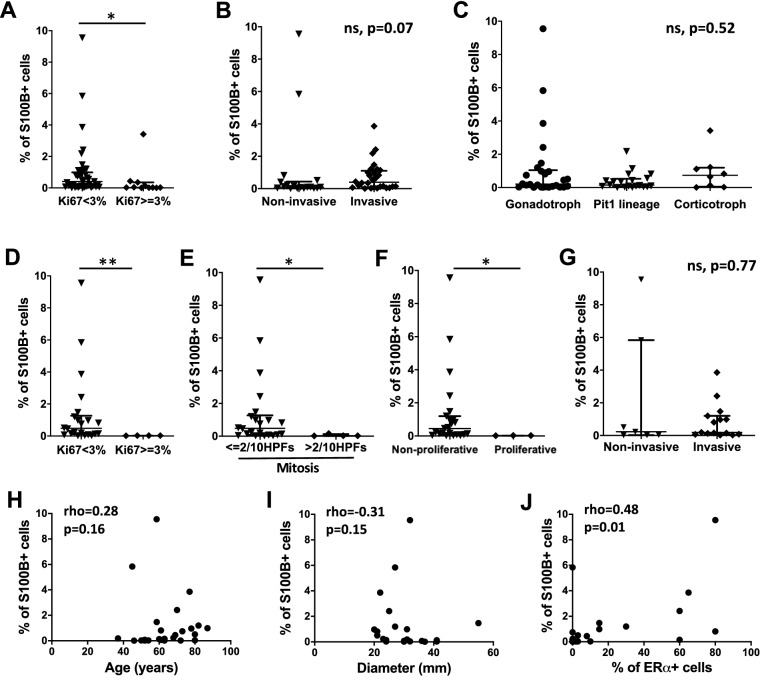
Fig. 3.
Association between clinicopathological characteristics and percentage of S100B + cells at the whole tumour level in PitNETs. A Percentage of S100B + cells in PitNETs with a Ki67 index < 3% (n = 43, median = 0.40%) versus a Ki67 index ≥ 3% (n = 11, median = 0.02%), p = 0.01 (*). B Percentage of S100B + cells in non-invasive (n = 18, median = 0.09%) versus invasive PitNETs (n = 28, median = 0.39%). C Percentage of S100B + cells in gonadotroph tumours (n = 26, median = 0.20%), tumours of the Pit1 lineage (n = 20, median = 0.14%), and corticotroph tumours (n = 8, median = 0.73%). D Percentage of S100B + in gonadotroph tumours with a Ki67 index < 3% (n = 22, median = 0.47%) versus a Ki67 index ≥ 3% (n = 4, median = 0.02%), p = 0.007 (**). E Percentage of S100B + cells in gonadotroph tumours with a number of mitosis ≤ 2/10 HPFs (n = 22, median = 0.47%) versus a number of mitosis > 2/10 HPFs (n = 4, median = 0.02%), p = 0.03 (*). F Percentage of S100B + cells in non-proliferative (n = 23, median = 0.44%) versus proliferative gonadotroph tumours (n = 3, median = 0.02%), p = 0.01 (*). G Percentage of S100B + cells in non-invasive (n = 7, median = 0.22%) versus invasive gonadotroph tumours (n = 15, median = 0.19%). H Correlation analysis between the percentage of S100B + cells and the age of patients in gonadotroph tumours (n = 26). I Correlation analysis between the percentage of S100B + cells and the maximal diameter in gonadotroph tumours (n = 22). J Correlation analysis between the percentage of S100B + cells and the percentage of ERα + cells in gonadotroph tumours (n = 25). Graphs: median with interquartile range (A–G), scatter plot (H–J). Statistical tests: Mann–Whitney (A–G), Kruskall-Wallis (C), Spearman’s correlation (H–J). Abbreviations: human pituitary neuroendocrine tumours (PitNETs), high power fields (HPFs), non-significant (ns)

