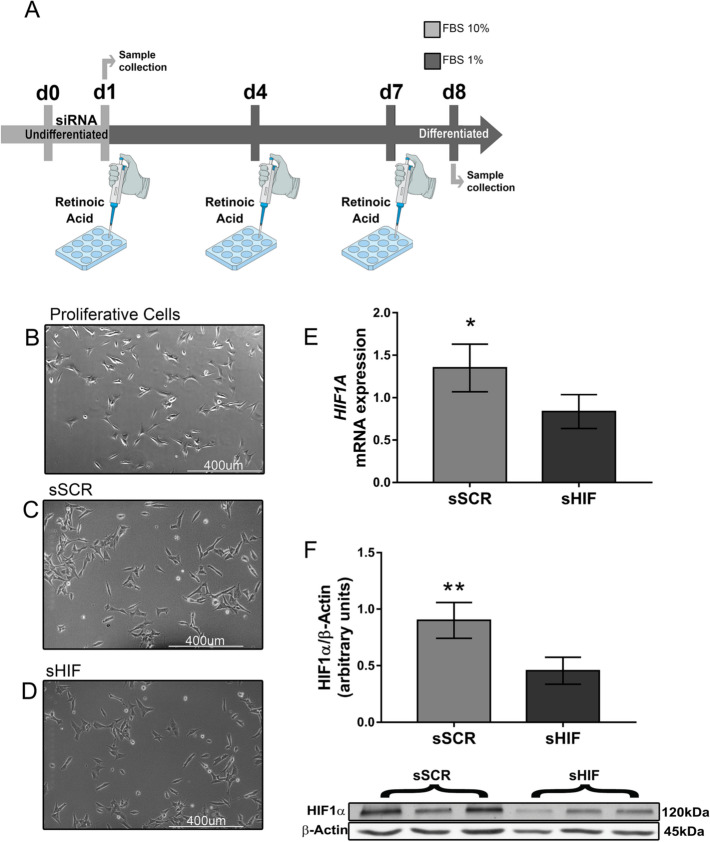
Fig. 1.
Cell silencing and differentiation protocol A Protocols were performed on a 9-day time span, from day 0 to day 7. On day 0, cells were trypsinised and seeded for reverse transfection. On day 1, either cells were collected for RT-qPCR and Western Blot or RA treatment was initiated on the concentration of 10 µM. On days 4 and 7, cells received RA pulses. On day 8, cells were either fixed for immunofluorescence microscopy or collected for RT-qPCR. HIF-1α siRNA transfection leads to a decrease in protein and mRNA levels without morphological alterations that could indicate changes in cell viability. B Phase microscopy shows cell morphology in growth conditions before plating and siRNA transfection (d0). Phase microscopy showing cell morphology after siRNA transfection (d1) of both HIF-1α siRNA (sHIF) (C) and scramble siRNA (sSCR) (D). In E HIF-1α mRNA levels (n = 4) and F HIF-1α protein levels (n = 6) after transfection. Bars represent mean ± SD (unpaired Student’s t-test *p < 0.01, **p < 0.005)

