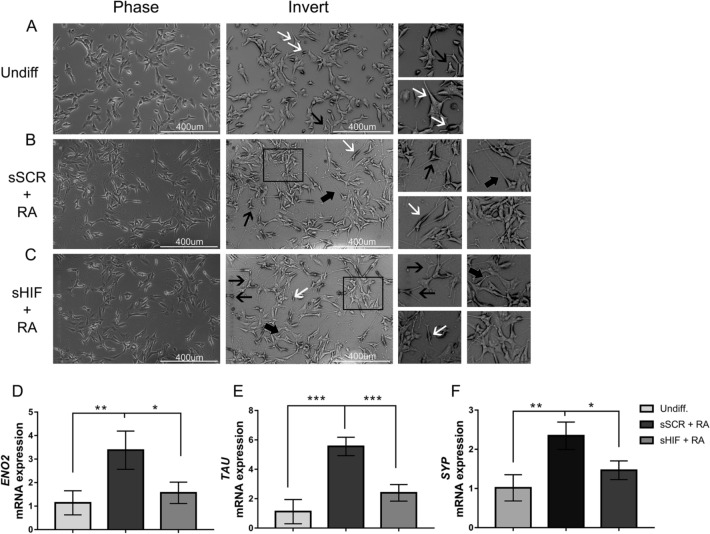
Fig. 2.
HIF-1α inhibition affects cell differentiation. Black arrows indicate triangular-shaped cells; white arrows indicate flat bipolar cells; thick black arrows indicate elongated unipolar cells; rectangles mark groups of proliferative cells. A Phase microscopy of undifferentiated cells demonstrating a triangular-shaped phenotype. B sSCR + RA demonstrate extensive projections. C sHIF + RA demonstrate shorter projections. Cells were collected for RNA extraction and further cDNA synthesis to analyse neuronal markers expression through RT-qPCR (n = 4). RA treatment leads to an increase in D ENO2, E SYP, F TAU in sSCR + RA compared to undifferentiated cells and sHIF + RA cells. HIF-1α silencing was able to reduce differentiation-related gene expression. Bars represent mean ± SD (one-way ANOVA followed by Tukey’s Multiple Comparison post-hoc test *p < 0.05, **p < 0.01 ***p < 0.001)

