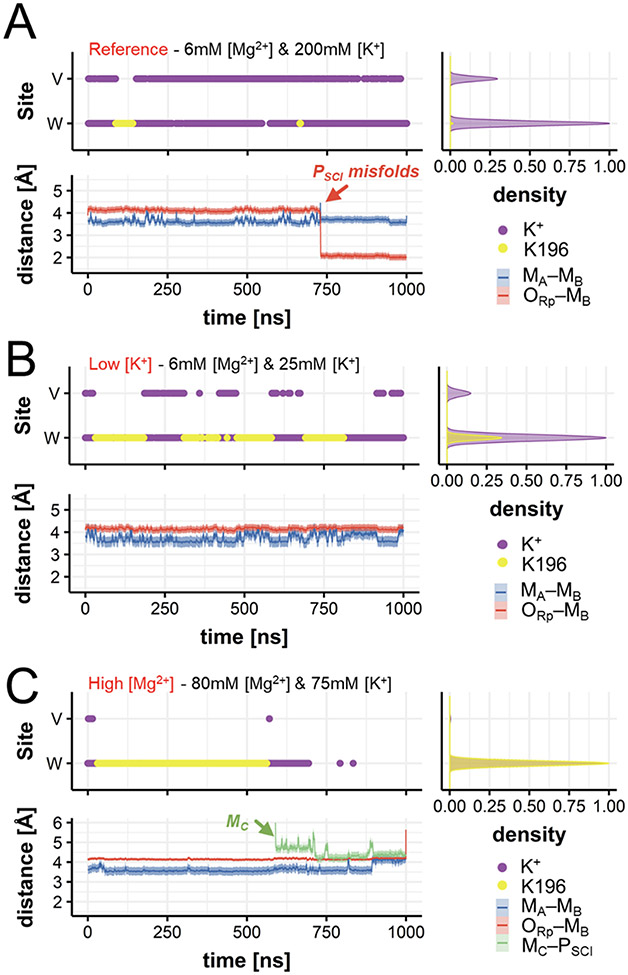
Figure 3.
Occupancy of positive charges (viz., K+ ions and K196) and conformational dynamics of the products. (A) Occupancy of the W and the V sites (upper panel) by K+ ions (purple) and by the K196 side chain (yellow); and distances (lower panel) between the catalytic ions MA–MB (blue trace), and between the pro-Rp oxygen of the scissile phosphate and MB (ORp–MB, red trace) during MD at optimal concentrations. Normalized densities are on the right. (B-C) Same descriptors as in (A) for MD simulations at low [K+] (B) and at high [Mg2+] (C). At low [K+], the interaction between K196 and the scissile phosphate is more frequent (Figure 4B). At high [Mg2+], MC approaches the scissile phosphate (green trace of MC–PSCI), while the MA–MB distance increases, preluding the release of the products (Figure 4C).

