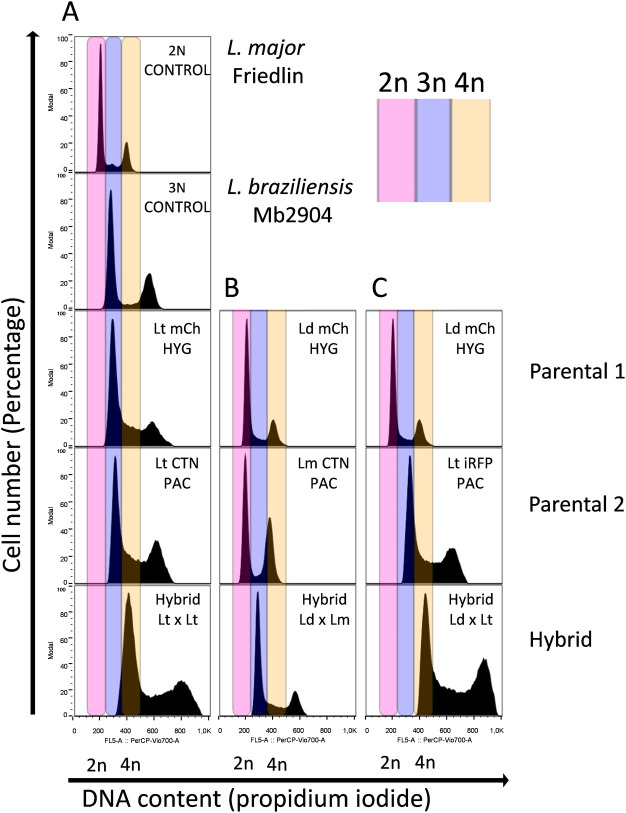
Fig 4. Analysis of the ploidy profile.
(A) Representative chart of flow cytometry showing the ploidy of L. tropica mCh HYG (Lt mCh HYG), L. tropica CTN PAC (Lt CTN PAC) and one hybrid of the intraclonal crossing (Hybrid 1 Lt x Lt). (B) Representative chart of flow cytometry showing the ploidy of L. donovani mCh HYG (Ld mCh HYG), L. major CTN PAC (Lm CTN PAC) and one hybrid of the interspecies crossing (Hybrid 1 Ld x Lm). (C) Representative chart of flow cytometry showing the ploidy of L. donovani mCh HYG (Ld mCh HYG), L. tropica iRFP PAC (Lt iRFP PAC) and one hybrid of the interspecies crossing (Hybrid 1 Ld x Lt). L. major Friedlin (ploidy = 2n) and L. braziliensis Mb2904 (ploidy = 3n) were used as ploidy controls (2N CONTROL and 3N CONTROL, respectively) in order to assess the ploidy of the rest of the parasites.

