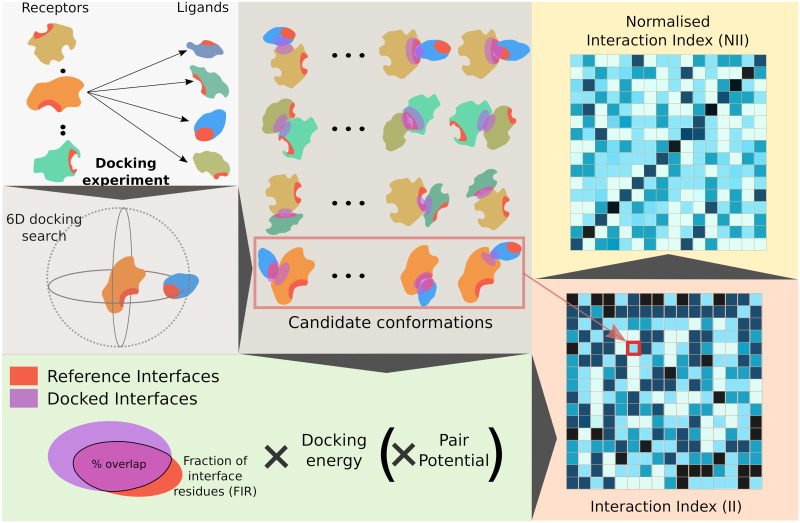
Fig 1. Principle of the method.
We start from an all-to-all docking experiment (top left panel). Each protein is docked to all proteins in the set. By convention, in each docking calculation, we define a receptor and a ligand. The red patches on the protein surfaces correspond to predicted interfaces. For a given protein pair P1 P2, we generate a pool of conformations associated with energies (top middle panel). Here, both the predicted interfaces and the docked interfaces are highlighted by patches, in red and purple respectively. One can readily see whether they overlap or not. The extent of this overlap (Fraction of Interface Residue) is multiplied by the docking energy to evaluate each docking conformation (bottom left panel). Optionally, we also consider a statistical pair potential in the formula. The best score is computed over all docking conformations and assigned to the protein pair. By doing the same operation for all pairs we compute a matrix of interaction indices (bottom right panel, the darker the higher). If the receptor and the ligand play equivalent roles in the docking calculations, then the matrix will be symmetrical. Otherwise, two different docking calculations are performed for each protein pair P1 P2 and the matrix will be asymmetrical, as shown here. These indices are then normalised to account for proteins’ global social behaviour, hopefully allowing for singling out the cognate partners (top right panel). In the example here, the cognate pairs are ordered on the diagonal.

