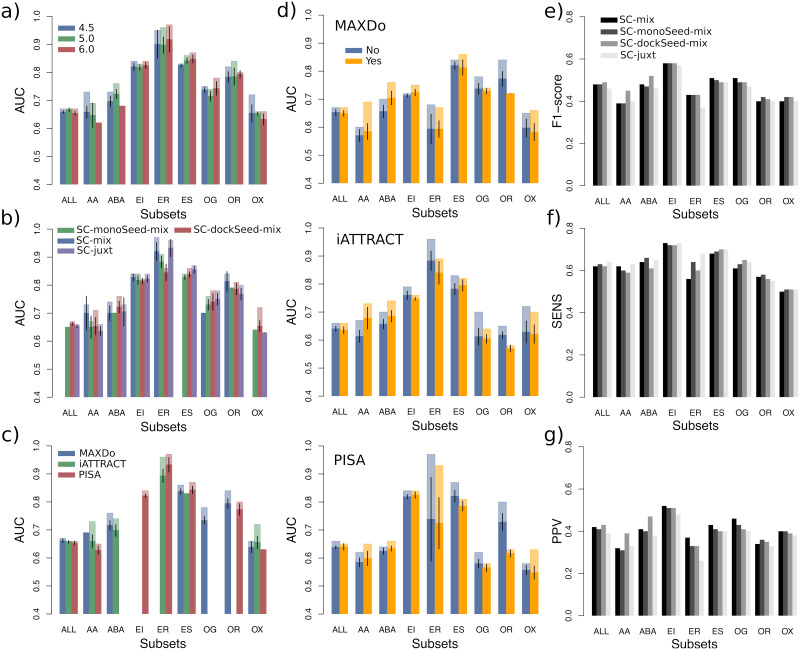
Fig 3. Influence of the parameters for PPDBv2 when considering predicted RIs.
(A-D) Variation of the AUC values upon parameter changes. The four parameters considered are: (A) the distance threshold used to define docked interfaces, (B) the scoring strategy used to predict interfaces, (C) the docking energy, and (D) the presence or absence of the pair potential, depending on the docking energy. In each plot, for each protein class, we considered the 15 combinations yielding the highest AUC values, among all 72 possible combinations. For a given parameter, the different bars correspond to a partition of this combination set according to the possible values of the parameter. If a parameter value was not present in the 15 best combinations, then it does not appear on the plot. We report the average AUC values (in opaque) and the maximum AUC values (in transparent). The black segments indicate the intervals [μ − 2σμ, μ + 2σμ], where μ is the mean and σμ is the standard error of the mean. (E-G) Resemblance between predicted and experimental interfaces. (E) F1-score. (F) Sensitivity. G) Positive predictive value.

