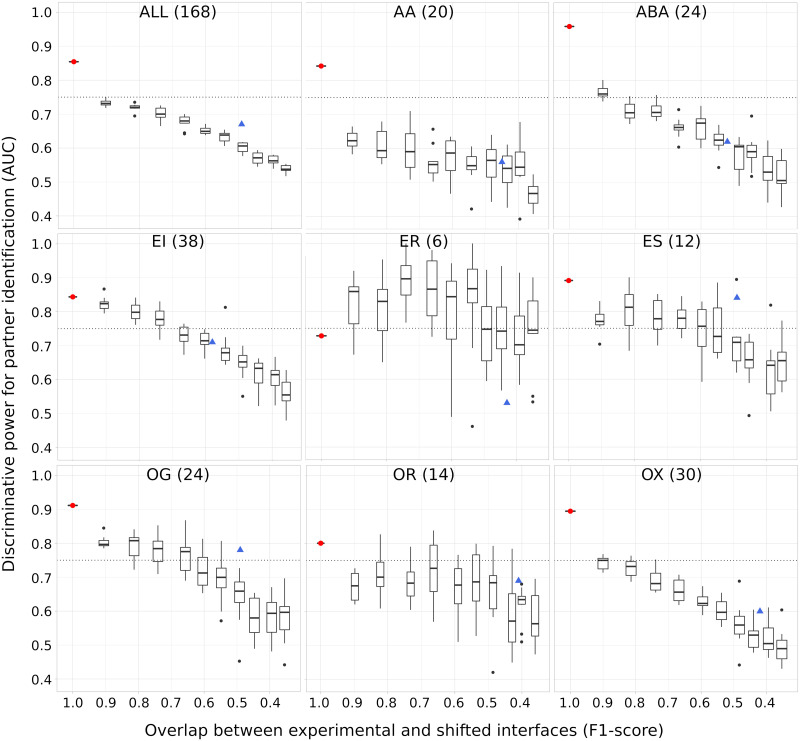
Fig 4. Sensitivity of partner identification to approximations in the reference interfaces.
The RIs were obtained by gradually shifting the experimental interfaces (see Materials and methods). On each plot, we show 10 boxes corresponding to 10 different shift magnitudes. Each box comprises 10 AUC values obtained from 10 random generations of shifts in interfaces at a given amplitude. The values in x-axis give the average F1-scores computed for these shifted interfaces. The red dot and the blue triangle indicate the performance achieved using the experimental interfaces and the interfaces predicted by SC-dockSeed-mix as RIs, respectively. To compute the AUCs, we used the parameters identified as the best ones when using the experimental interfaces as RIs, namely a distance threshold of 6Å, the MAXDo docking energy, and without CIPS.

