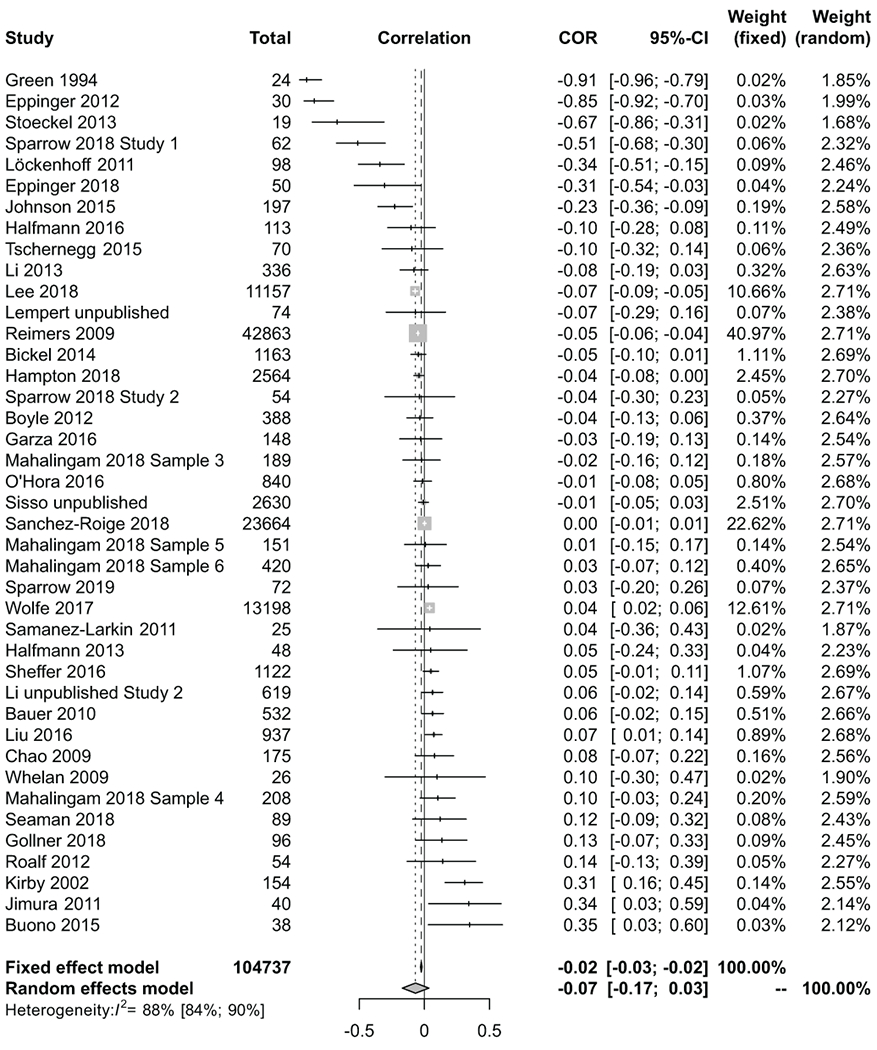
Figure 2. Forest Plot for all Studies.

The position of the squares on the x-axis indicates the effect size for each study; the bars indicate the 95% confidence interval for the effect size and the squares represent the inverse of the standard error. Positive effect sizes reflect more discounting with age whereas negative effect sizes reflect less discounting with age.
