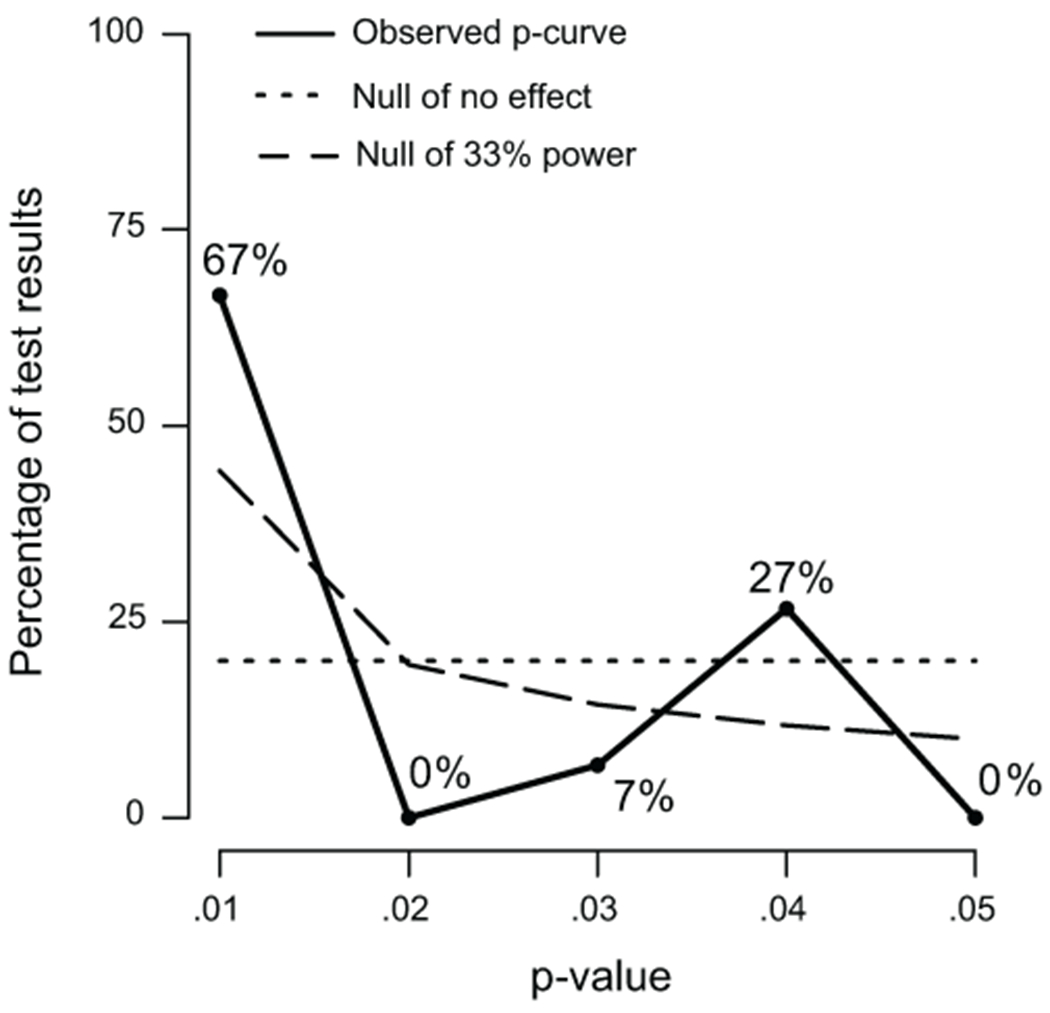
Figure 4. P-curve analysis.

Plot showing the p-value of each study on the x-axis and the percentage of study results at that level on the y-axis. The solid blue line denotes the observed p-curve, which has an estimated power of 99%. There is no evidence of a right-skewness (green dashed line) or flatness (red dotted line) in the included data.
