. 2022 Feb 9;130(2):027004. doi: 10.1289/EHP9406

Figure 1.

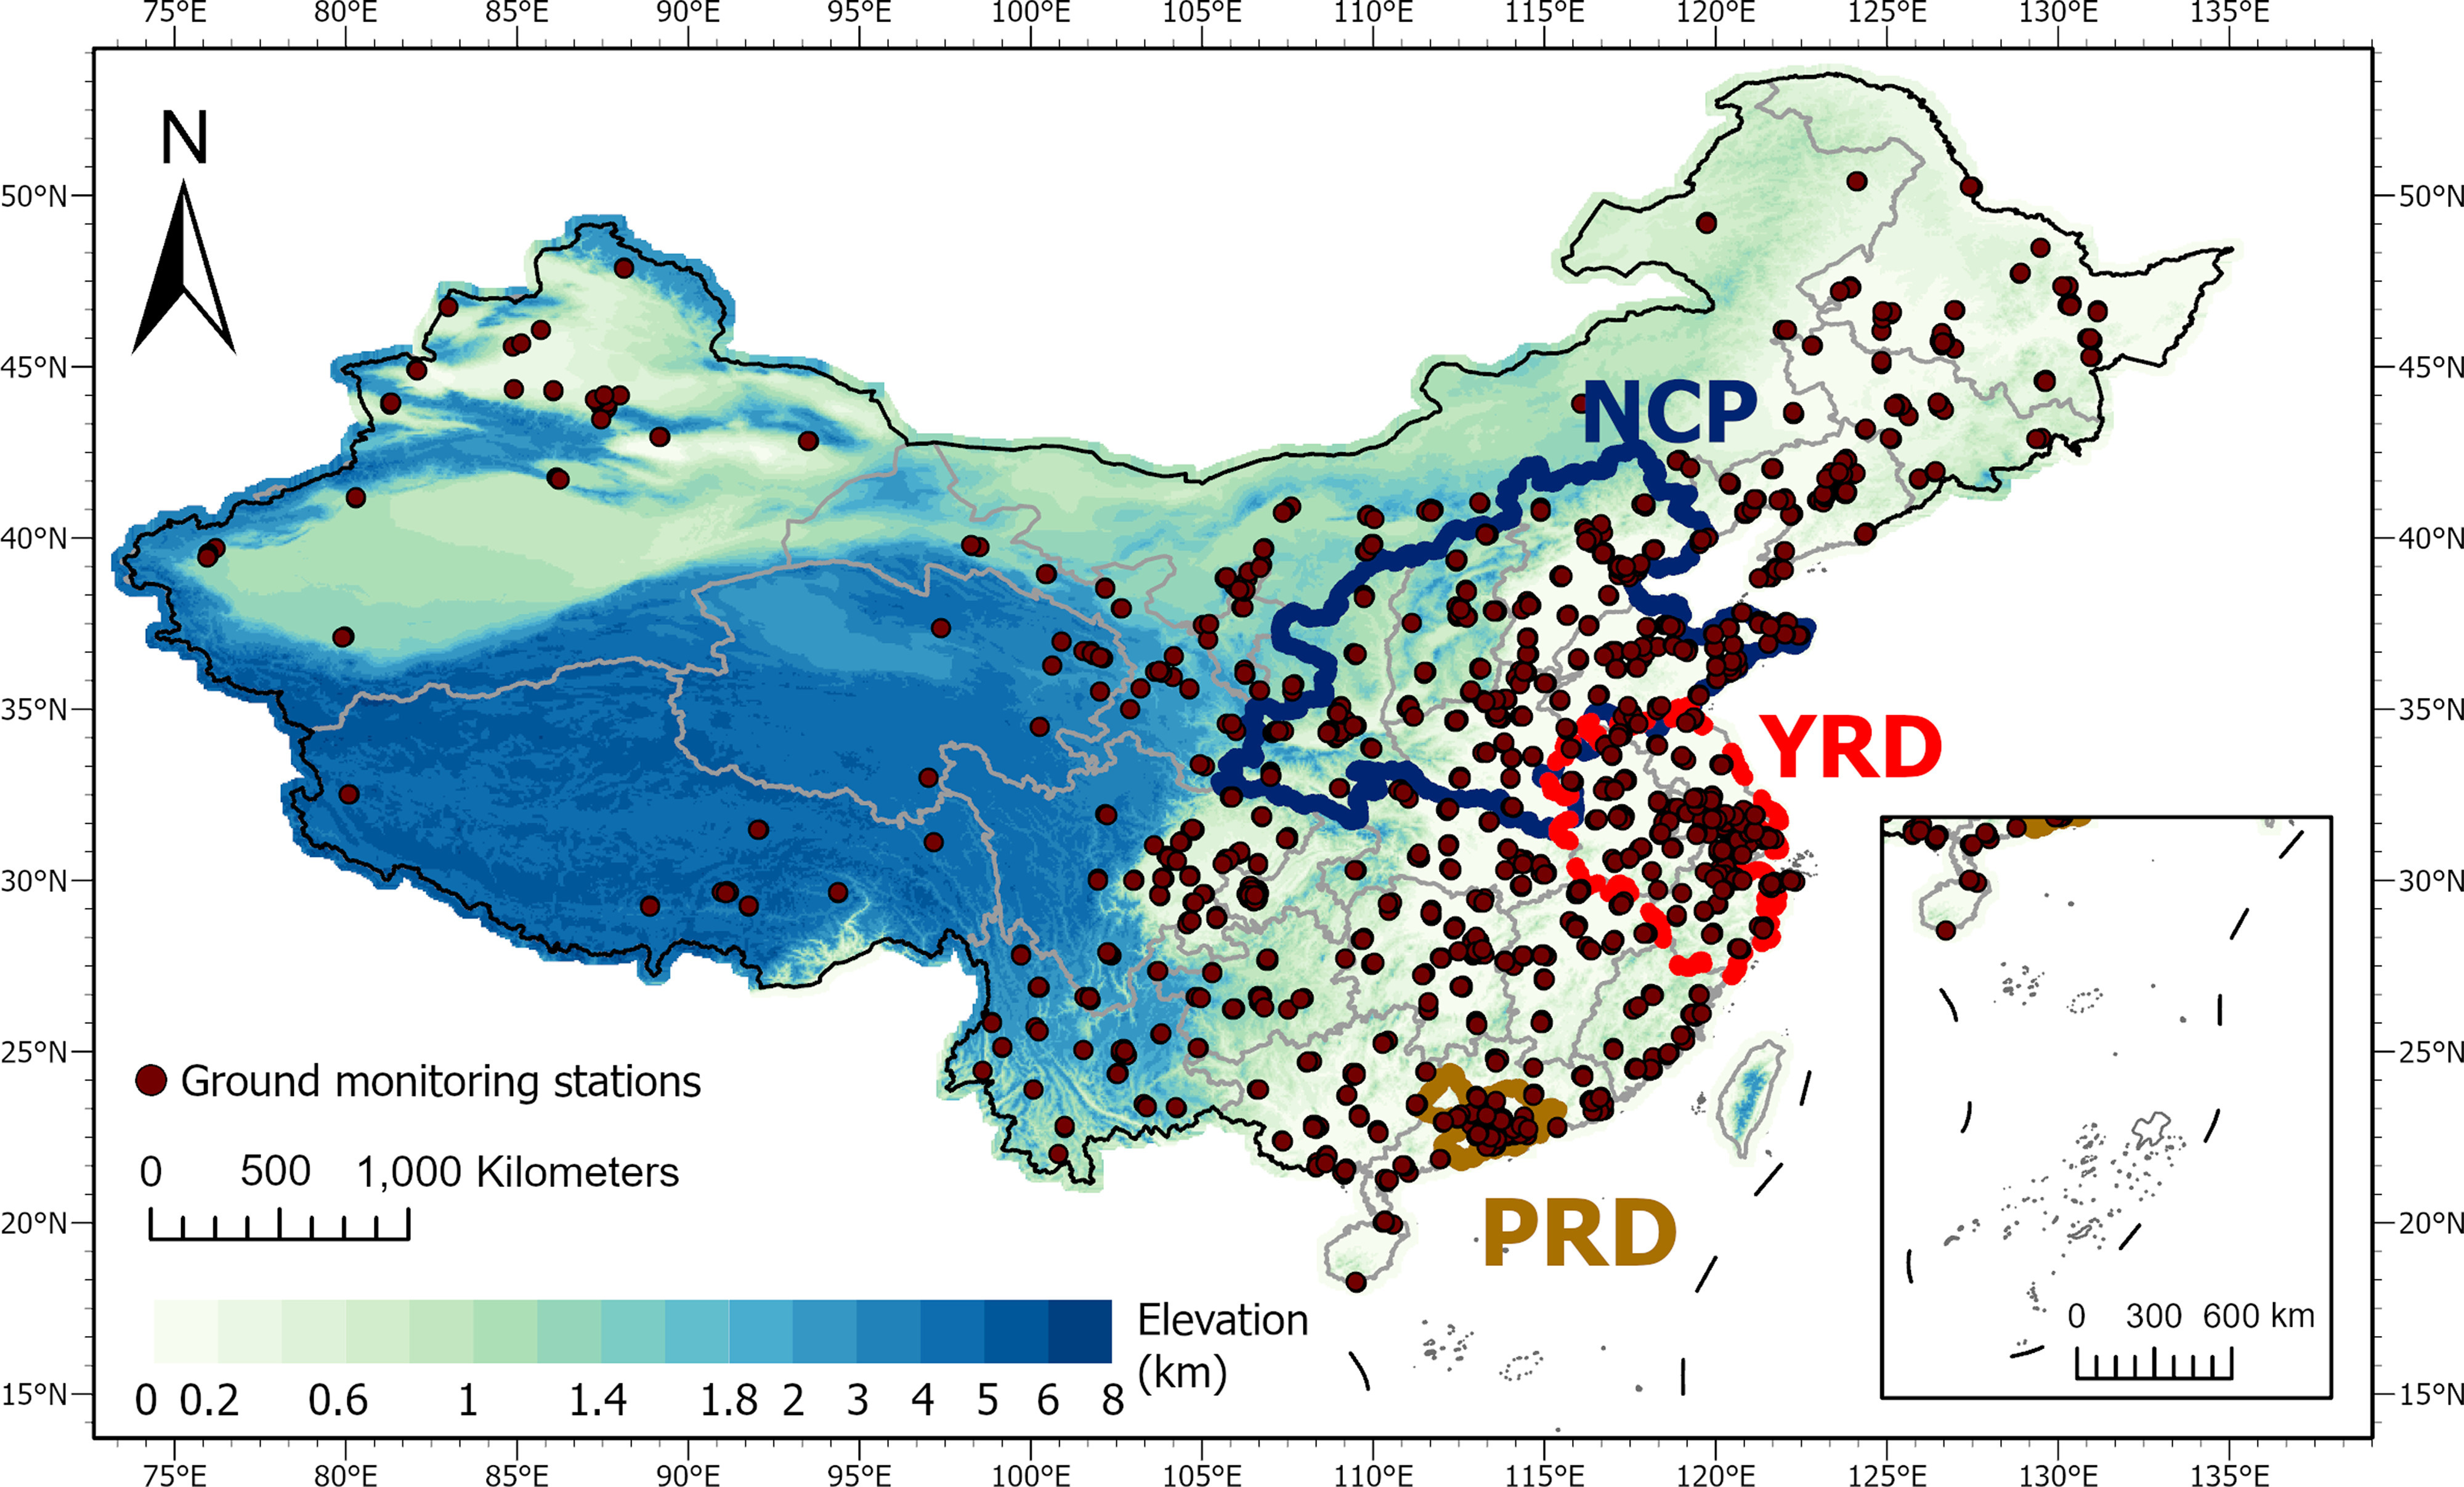
Figure 1 is a map of China depicting three major city clusters, including the North China Plain, the Yangtze River Delta region, and the Pearl River Delta region. The points represent the location of ground monitoring sites by the China National Environmental Monitoring Center. A color scale depicting Elevation (kilometer), ranging from 0 to 1.8 in increments of 0.4; 1.8 to 2 in increments of 2; and 2 to 8 in unit increments. A scale depicting kilometers, ranging from 0 to 1,000 in increments of 500 and another scale depicting kilometers, ranging from 0 to 600 in increments of 300.

The study domain and three major city clusters. The study domain covered China plus a 50-km buffer region that extends outside the national boundary. The points are the location of the China National Environmental Monitoring Center monitoring sites. The color scale represents elevation (km). Note: NCP, North China Plain; PRD, Pearl River Delta region; YRD, Yangtze River Delta region.