. 2022 Feb 9;130(2):027004. doi: 10.1289/EHP9406

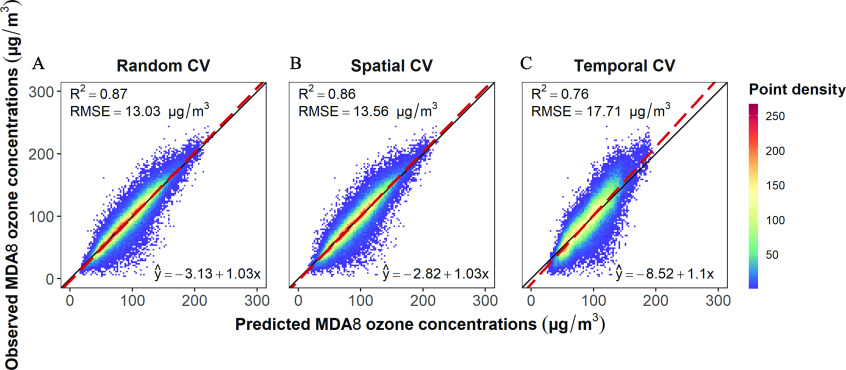
Figure 2.

Figures 2A, 2B, and 2C are three linear regression graphs titled Random cross-validation, Spatial cross-validation, and Temporal cross-validation, respectively, plotting Observed daily maximum 8-hour average ozone concentrations (micrograms per meter cubed), ranging from 0 to 300 in increments of 100 (y-axis) across Predicted daily maximum 8-hour average ozone concentrations (micrograms per meter cubed), ranging from 0 to 300 in increments of 100 (x-axis) for uppercase r squared and Root mean squared error, respectively. A color scale depicting point density is ranging from 50 to 250 in increments of 50.

The integrated model performance of the original model with OMI L24 retrieval. (A) Random CV; (B) spatial CV; and (C) temporal CV. The functions on the bottom-right corners are the regression functions between the predicted and observed monthly mean MDA8 ozone concentrations. Red dashed lines represent the regression line between the predictions and observations; black solid lines represent the x=yline. The color scale represents the density of the points. Note: CV, cross-validation; L24, boundary layer; MDA8, daily maximum 8-h average; OMI, Ozone Monitoring Instrument.