. 2022 Feb 9;130(2):027004. doi: 10.1289/EHP9406

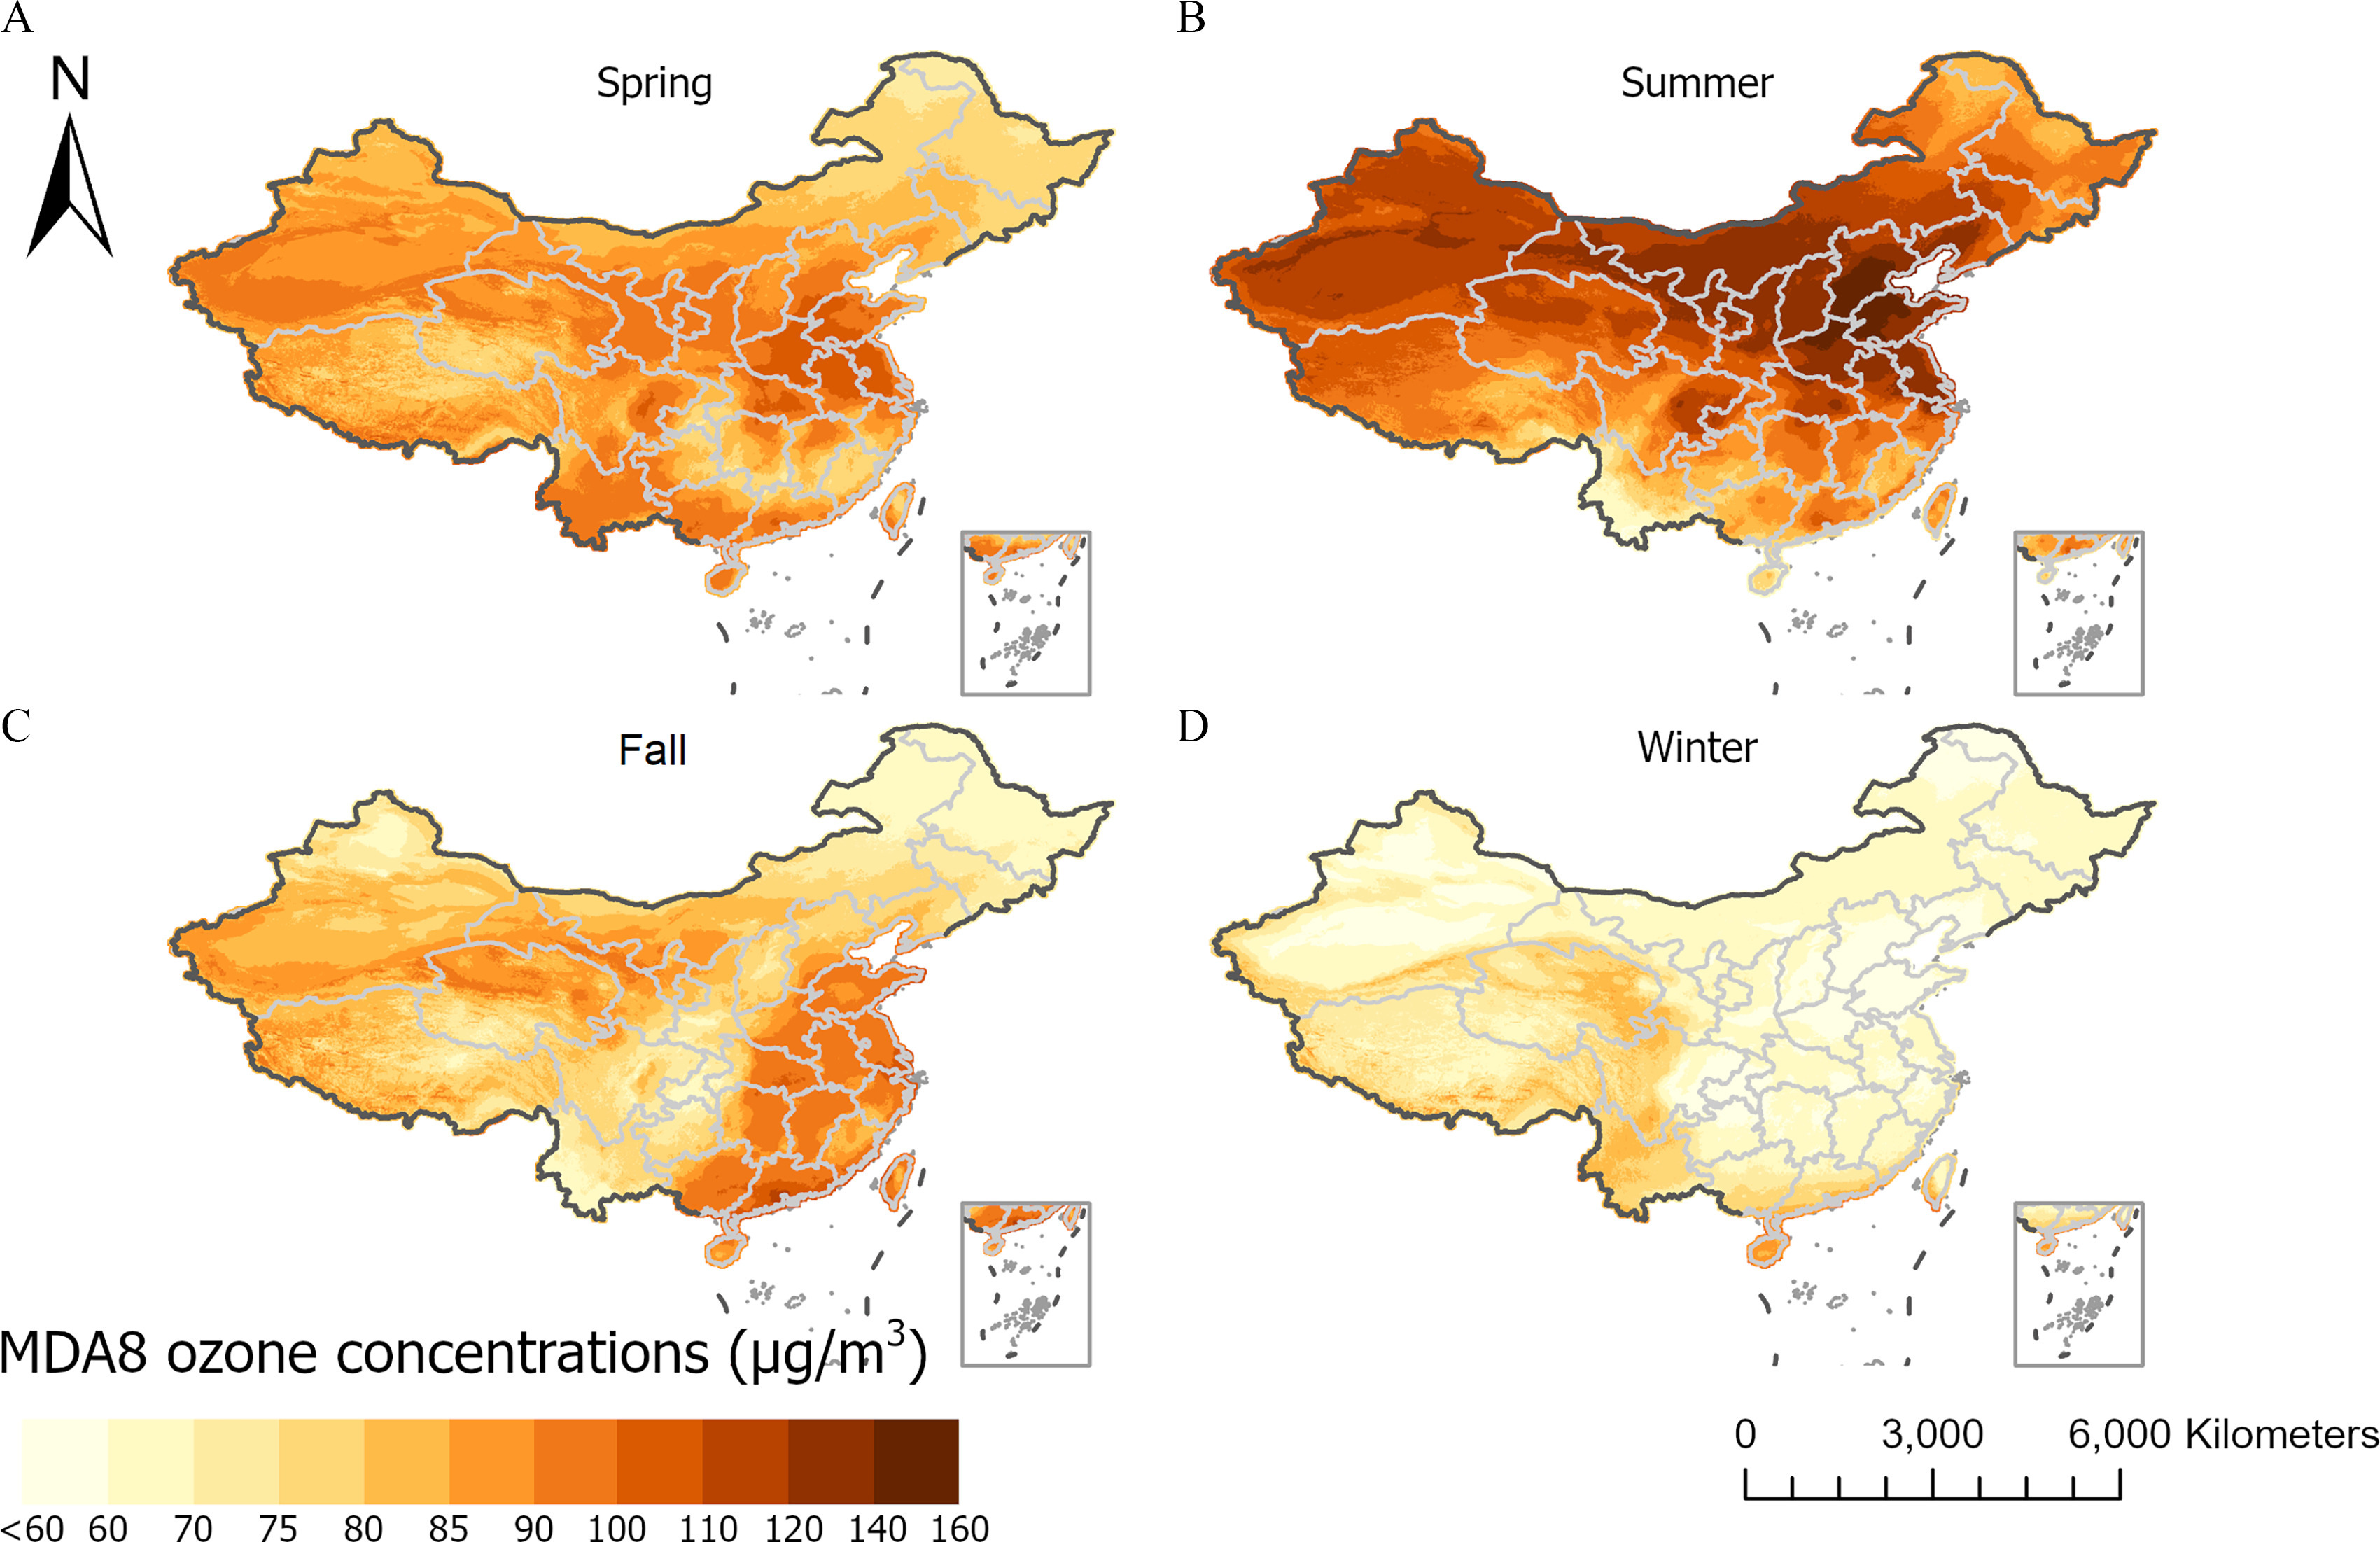
Figure 3.

Figures 3A, 3B, 3C, and 3D are four maps of China depicting seasonal average daily maximum 8-hour average ozone concentrations from 2005 to 2019 in four seasons, including Spring, Summer, Fall, and Winter, respectively. Spring covers March to May months; Summer covers June to August months; Fall covers September to November months; and Winter covers December to February months. A color scale depicting daily maximum 8-hour average ozone concentrations (micrograms per meter cubed), ranging from less than 60 to 70 in increments of 10, 70 to 90 in increments of 5, 90 to 120 in increments of 10, and 120 to 160 in increments of 20. A scale depicting kilometers is ranging from 0 to 6,000 in increments of 3,000.

Spatial distribution of seasonal average MDA8 O3 concentrations during 2005–2019. The O3 concentrations were predicted by the original model with OMI L24 retrieval and averaged seasonally over 2005–2019. (A) Spring: March–April–May; (B) summer: June–July–August; (C) fall: September–October–November; and (D) winter: December–January–February. Note: MDA8, daily maximum 8-h average; O3, ozone; OMI, Ozone Monitoring Instrument.