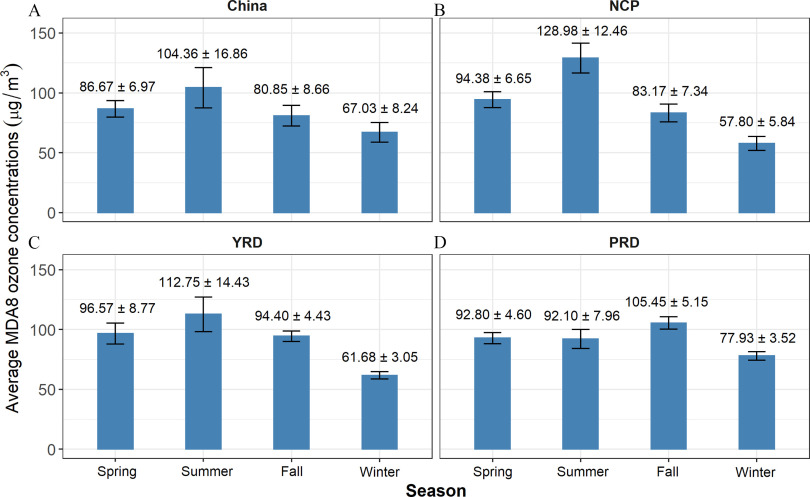
Figure 4.
Region-specific seasonal mean MDA8 concentrations during 2005–2019 for (A) China as a whole, (B) the North China Plain (NCP), (C) the Yangtze River Delta region (YRD), and (D) the Pearl River Delta (PRD). The concentrations were predicted by the original model with OMI L24 retrievals. The bars and the corresponding numbers represent the season-specific regional mean MDA8 concentrations () over 2005–2019. Note: Fall, September–October–November; MDA8, daily maximum 8-h average; , ozone; OMI, Ozone Monitoring Instrument; spring, March–April–May; summer, June–July–August; winter, December–January–February.

