. 2022 Feb 9;130(2):027004. doi: 10.1289/EHP9406

Figure 5.

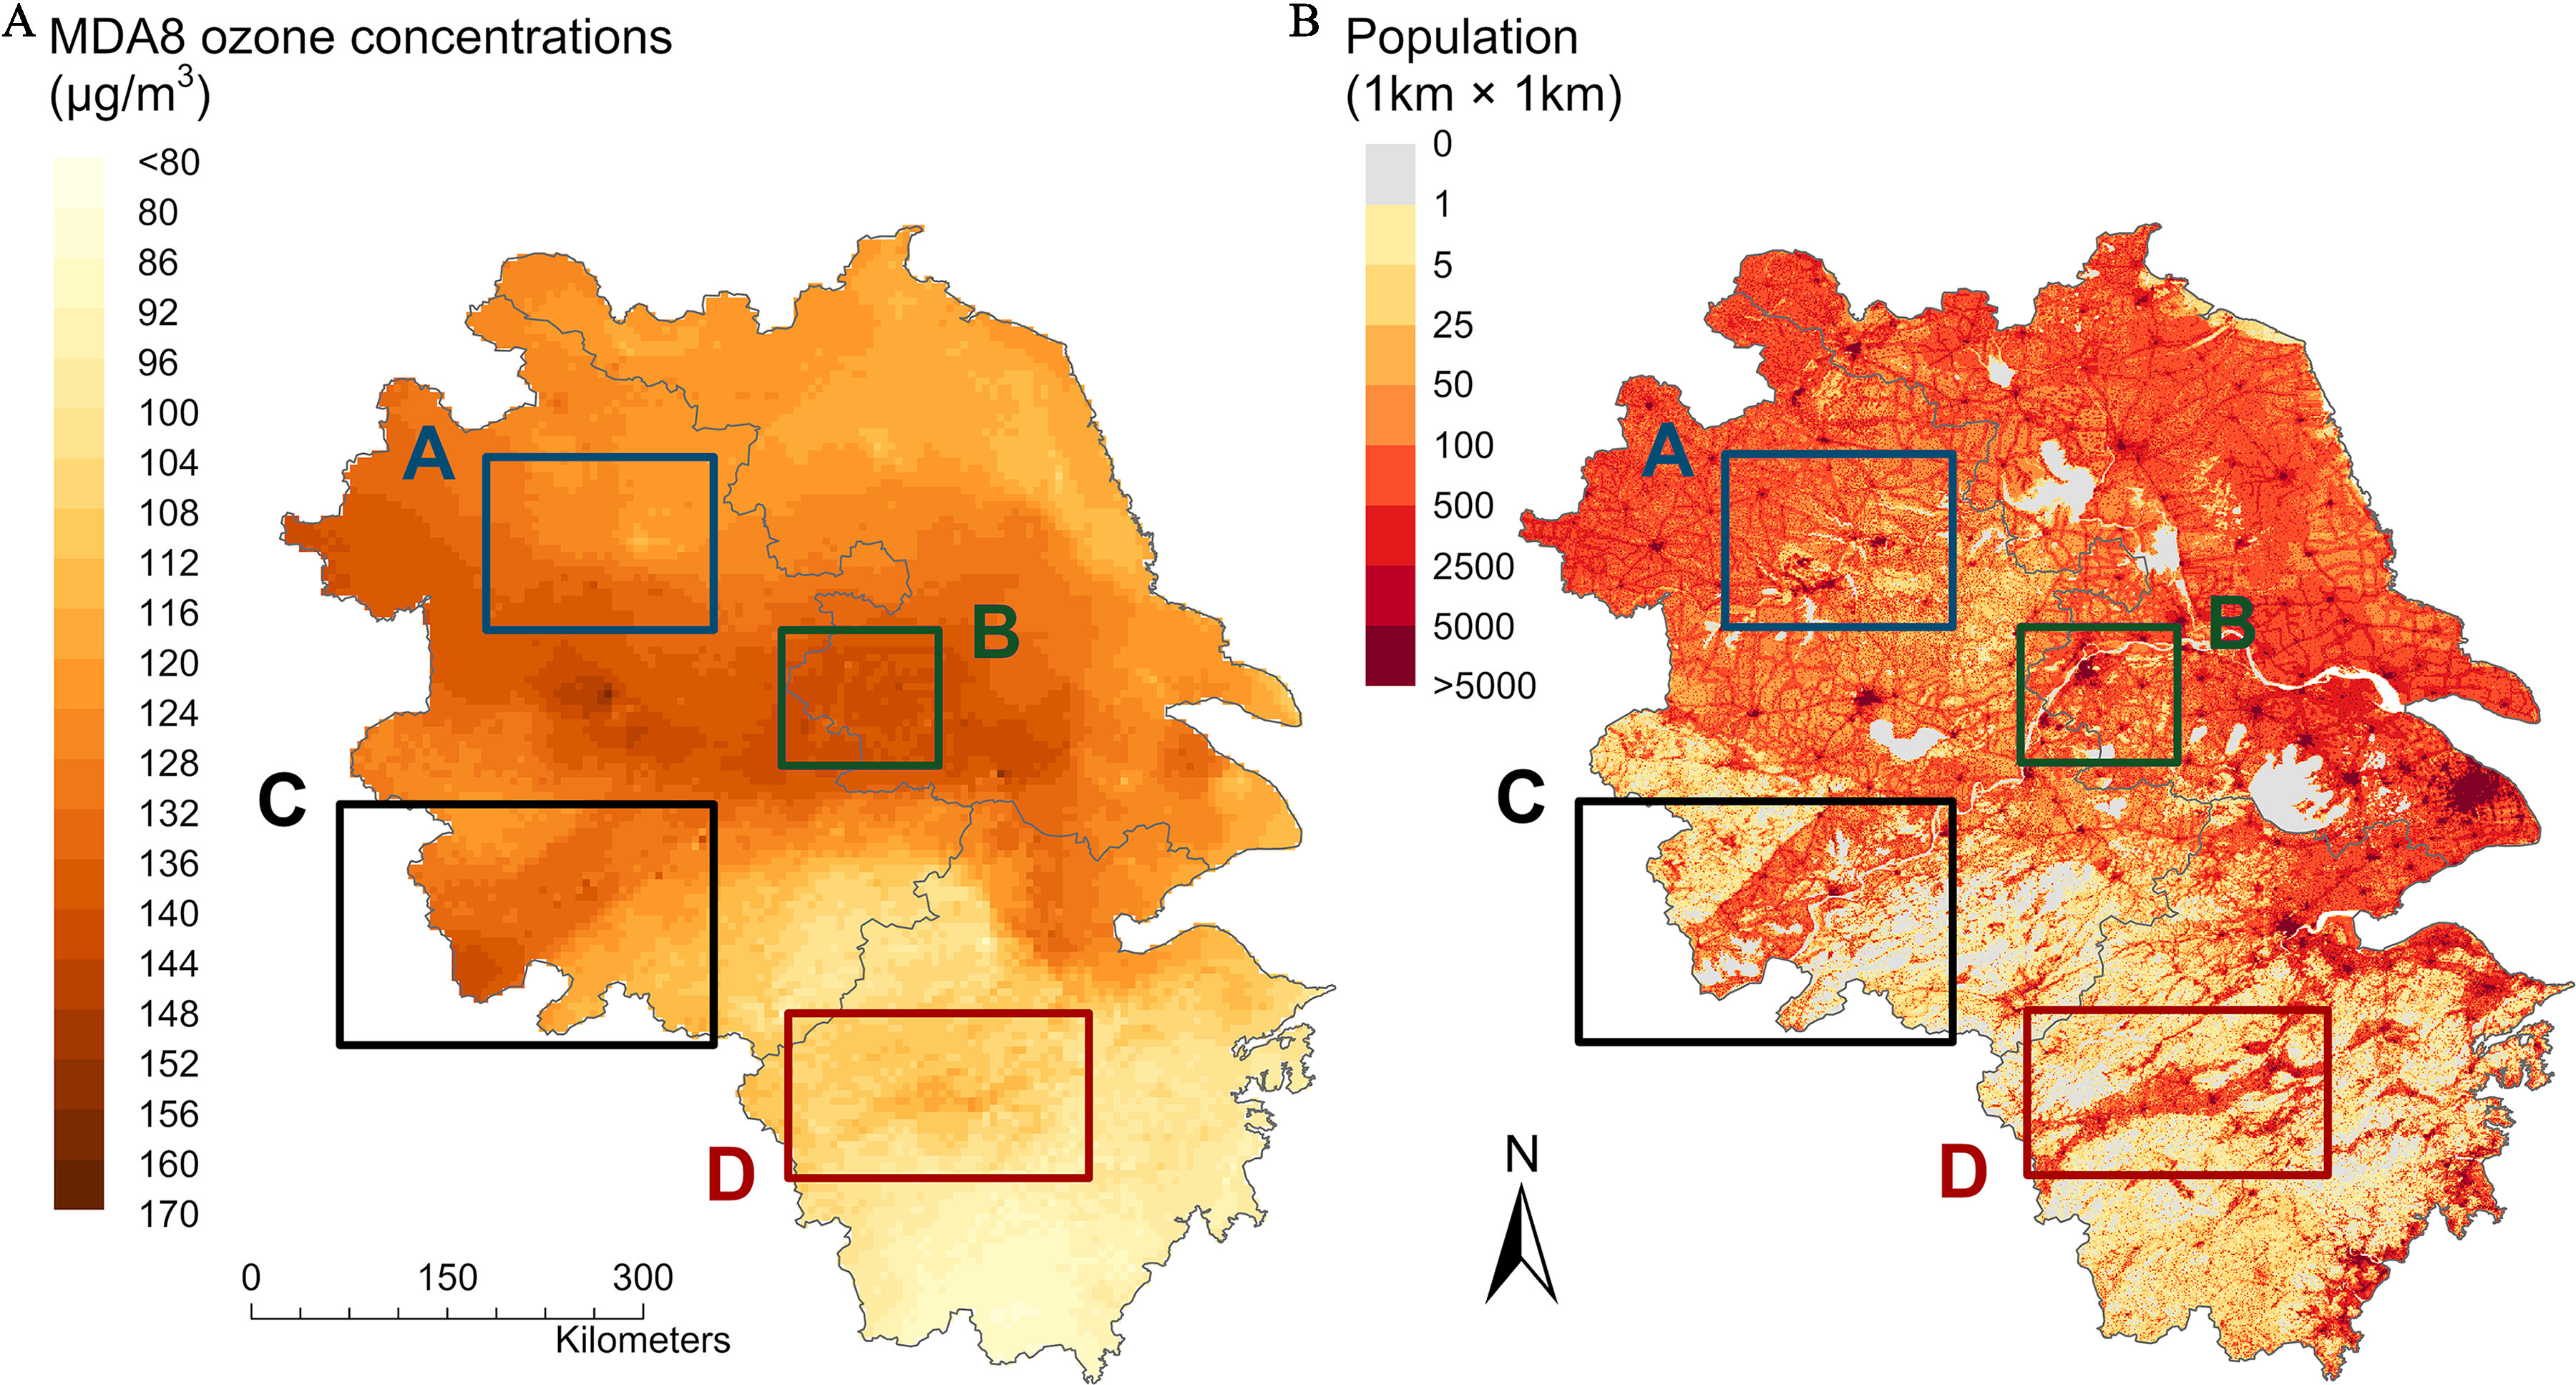
Figures 5A and 5B are two maps of Yangtze River Delta depicting Summer ozone peak and population, respectively. Yangtze River Delta cities and their surrounding area are marked, including A: Bengbu and Huainan City; B: Nanjing Metropolitan Area; C: Anqing City; and D: Quzhou and Jinhua City. A color scale of depicting daily maximum 8-hour average ozone concentrations (micrograms per meter cubed) is ranging from less than 80 to 80 in increments of 10, 80 to 92 in increments of 6, 92 to 160 in increments of 4, and 160 to 170 in increments of 10. A color scale depicting population (1 kilometer by 1 kilometer) is ranging from 0 to 5 in increments of 5, 5 to 25 in increments of 20, 25 to 50 in increments of 25, 50 to 100 in increments of 50, 100 to 500 in increments of 400, 500 to 2,500 in increments of 2,000, 2,500 to 5,000 in increments of 2,500, and 5,000 to greater than 5,000 in increments of 5,000. A scale depicting kilometers is ranging from 0 to 300 in increments of 150.

Summer O3 peak and population in the Yangtze River Delta (August 2019). (A) The model-predicted monthly mean MDA8 O3 concentrations in August 2019; and (B) the 1-km population data for 2019 from LandScan. The boxes represent some YRD cities and their surrounding areas: A, Bengbu and Huainan City; B, Nanjing Metropolitan Area; C, Anqing City; and D, Quzhou and Jinhua City. Note: MDA8, daily maximum 8-h average; O3, ozone; YRD, the Yangtze River Delta.