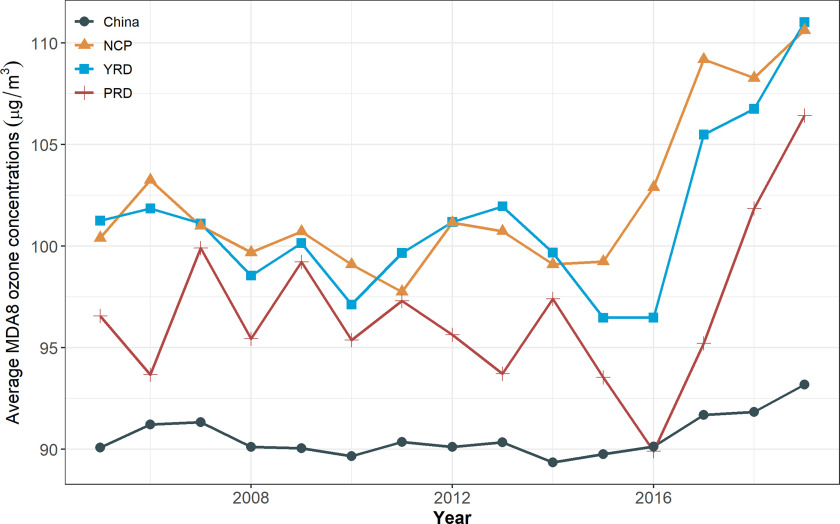
Figure 6.
Annual trend of mean season average MDA8 concentrations from 2005 to 2019. season is defined as March–November. The lines with different colors and marks represent the model-predicted mean MDA8 concentrations in different regions. Gray line with round marks denotes China; the red line with cross marks, the PRD; the orange line with triangular marks, the NCP; and the blue line with square marks, the YRD. Note: MDA8, daily maximum 8-h average; NCP, the North China Plain; , ozone; PRD, the Pearl River Delta; YRD, the Yangtze River Delta.

