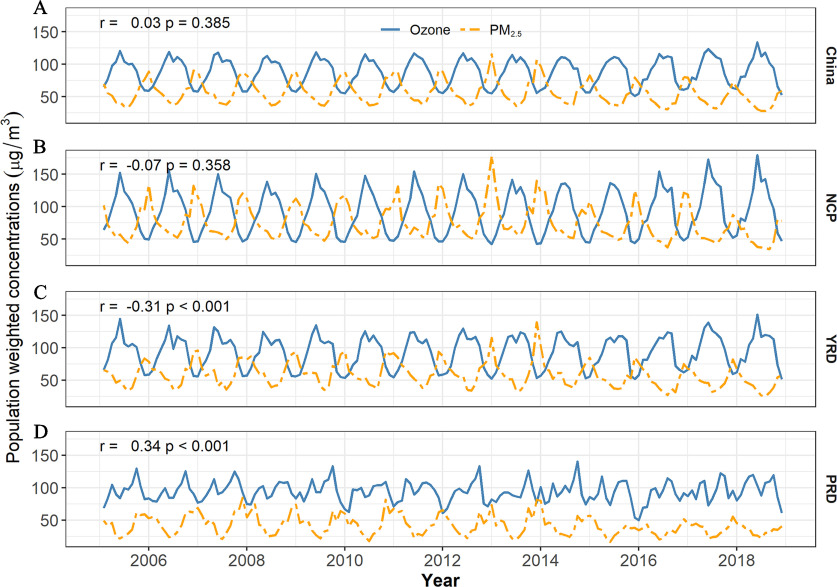
Figure 8.
Time-series comparison for population-weighted ambient and concentrations in China over 2005–2018. (A) China as a whole; (B) the NCP; (C) the YRD; and (D) the PRD. r denotes the partial correlation coefficient controlling for temperature, relative humidity, and total precipitation from MERRA-2. -Values were for the r statistics. Blue lines represent the population-weighted monthly mean MDA8 predicted by our model, and the orange lines represent the population-weighted monthly mean concentrations from Xiao et al. (2021). Note: MDA8, daily maximum 8-h average; MERRA-2, Modern-Era Retrospective Analysis for Research and Applications; NCP, the North China Plain; , ozone; PRD, the Pearl River Delta; YRD, the Yangtze River Delta.

