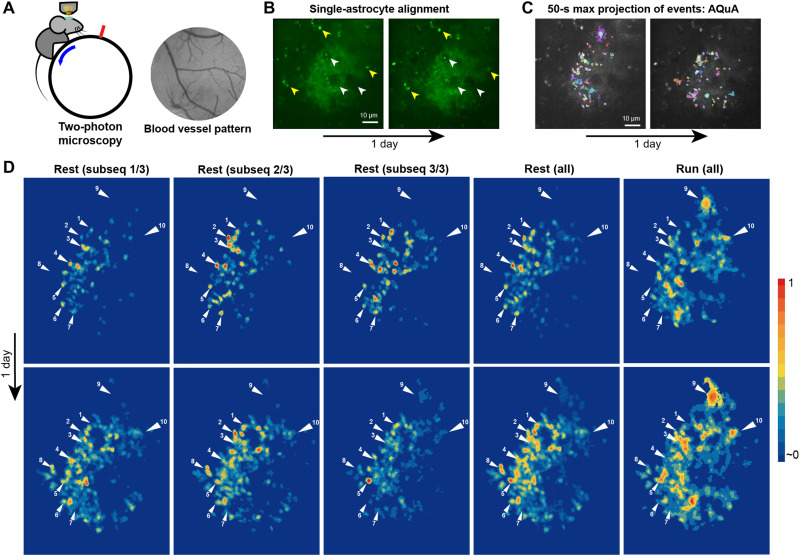
Fig. 4. Astrocyte Ca2+ hotspot stability over time.
(A) Single astrocytes were recorded using 2P microscopy in head-fixed mice free to move on a treadmill (left). The coordinates of single astrocytes were mapped in relation to the blood vessel pattern obtained using wide-field microscopy (right). (B) Z-plane alignment of the same astrocyte between days by aligning morphological features: astrocyte morphology, blood vessels passing through the astrocyte (white pointers) and fluorescent puncta patterns (yellow pointers). (C) 50-s maximum projection of Ca2+ signals extracted with AQuA of the same astrocyte recorded over 1 day. (D) Normalized hotspot maps of an astrocyte recorded 1 day apart during rest and running (run all). Activity heatmaps during rest state (rest all) were split into three equitemporal subsequences (rest subsequence, 20 min each). Similar hotspot patters can be observed between subsequences within day (within row), between days (top row versus bottom row), and during rest and run (white pointers 1 to 10 indicate example hotspot loci). Some hotspots are appearing or disappearing over time or during different behavioral state (rest versus run). All heatmaps were normalized to their maximum pixel value.

