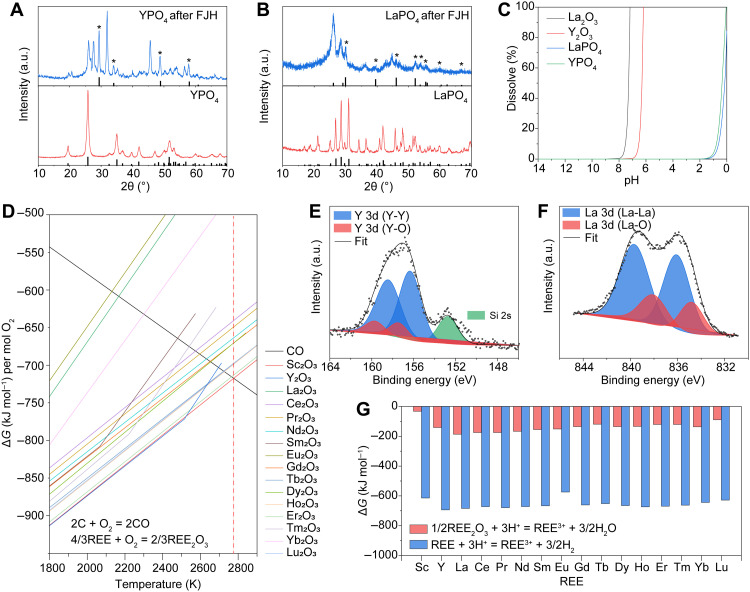
Fig. 3. Mechanism of the improved REE extractability by the electrothermal activation.
(A) XRD patterns of YPO4 (bottom) with reference PDF (YPO4, #11-0254) and YPO4 after FJH (top) with reference PDF (Y2O3, #43-0661). (B) XRD patterns of LaPO4 (bottom) with reference PDF (LaPO4, #35-0731) and LaPO4 after FJH (top) with reference PDF (La2O3, #05-0602). The asterisks denote the diffraction peaks from La2O3. (C) Calculated dissolution curves of Y2O3, YPO4, La2O3, and LaPO4 with a mass of 1 g in 100-ml solution. Cl− is used to balance the charge. (D) Ellingham diagram of carbon monoxide and REE oxides. The red dashed line denotes the temperature to reduce Sc2O3. (E) XPS fine spectrum of Y2O3 after FJH. The Si signal might be from the quartz tube during FJH. (F) XPS fine spectrum of La2O3 after FJH. (G) Gibbs free energy change of the REE oxide and REE metal dissolution reactions in acid.

