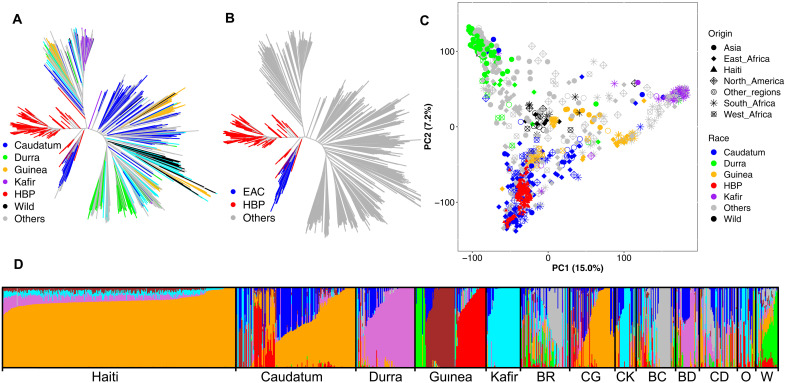
Fig. 2. Population structure of the HBP in relation to global sorghum diversity reflects its derivation from East African germplasm.
Genetic relatedness of the HBP to the global diversity assessed by neighboring joining method, color-coded by botanical type (A) or highlighting the close relationship between the HBP and East African caudatum (EAC) germplasm (B). (C) Scatterplot of the first two principal components (PC) of genome-wide SNP variation, demonstrating the clustering of HBP within EAC germplasm. (D) Bayesian hierarchical clustering of the HBP and GDP with the probability of membership (Q) in each of K = 8 ancestral populations. The Q value bar plots are arranged by botanical types to reflect the relationship of the HBP to the GDP. Note that color-coding of the bar plots in (D) is arbitrary and does not reflect the color code in (A) to (C). BR, bicolor; CG, caudatum-guinea; CK, caudatum-kafir; BC, bicolor-caudatum; BD, bicolor-durra; CD, caudatum durra; O, others (includes botanical types containing less than 10 individuals); W, wild.

