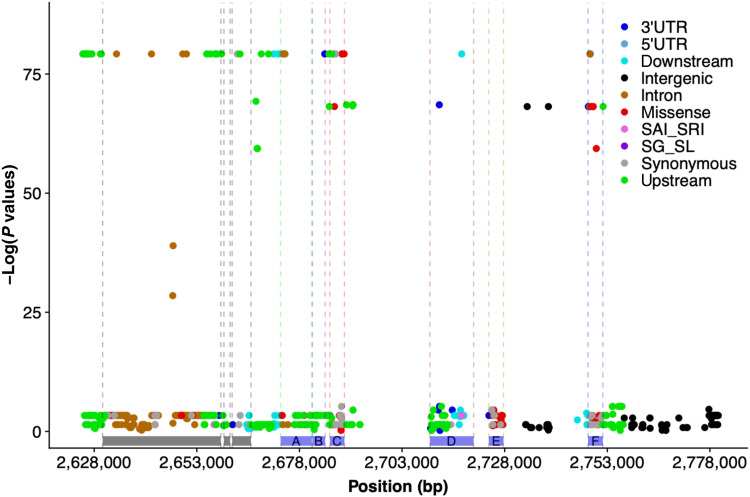
Fig. 4. Whole-genome resequencing and local association mapping identifies potential causative variants at RMES1.
Functional annotation and association mapping of nucleotide polymorphisms within the RMES1 locus across a set of 13 diverse sorghum accessions with known SCA resistance or susceptibility. The −log of P values of local marker-trait association scan plotted against the chromosomal positions at the RMES1 locus on chromosome 6. Variants are color-coded by annotation generated by the SnpEff program. Blue bars represent the seven annotated genes within the RMES1 interval (A, Sobic.006G017000; B, Sobic.006G017100; C, Sobic.006G017200; D, Sobic.006G017332 and Sobic.006G017266; E, Sobic.006G017400; F, Sobic.006G017500.v3.1). Gray bars indicate genes outside the RMES1 interval as originally defined (25). 3′UTR, 3′ untranslated region variant; SAI_SRI, splice acceptor/intron or splice region intron variants; SG_SL, stop gained or stop loss variant.

