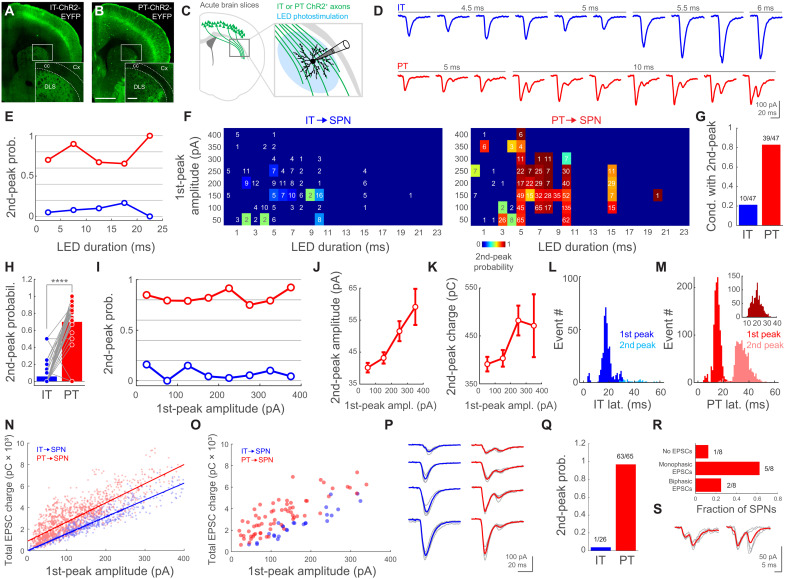
Fig. 1. PT corticostriatal inputs evoke biphasic responses onto SPNs.
(A and B) Images from IT- or PT-ChR2-EYFP mice. Scale bar, 1 mm; inset, 200 μm. (C) Experiment schematic. LED, light-emitting diode. (D) Examples of individual EPSCs upon IT/PT photostimulation. (E) Second-peak probability versus photostimulation duration. Biphasic/total trials: IT bins (blue), 13/260, 9/114, 2/20, 3/18, and 0/5 from 26 SPNs, 10 mice; PT bins (red), 206/294, 725/807, 86/128, 53/81, and 6/6 from 65 SPNs, 31 mice. (F) Matrices of biphasic EPSC probability. Trials/SPNs/mice: IT, 230/26/10; PT, 977/61/31. Numbers: trials per condition. (G) Proportion of conditions in (F) with at least one biphasic EPSC. (H) Paired biphasic EPSC probability for the 47 conditions in (F). P = 5.31 × 10⁻⁸; Wilcoxon signed-rank test. (I) Second-peak probability versus first-peak amplitude. Biphasic/total trials: IT bins (blue), 4/25, 0/38, 14/94, 4/93, 2/74, 3/56, 2/20, and 1/23 from 26 SPNs, 10 mice; PT bins (red), 213/251, 308/388, 211/267, 160/195, 107/117, 42/56, 23/29, and 12/13 from 65 SPNs, 31 mice. (J and K) Mean amplitude/charge of PT➔SPN second EPSC versus first-peak amplitude. (L and M) Histogram of first- and second-peak latencies. Trials/SPNs/mice: IT, 423/26/10. PT, 1316/65/31. Inset in (M): First- to second-peak latencies in individual trials; 1076/65/31. (N and O) Total EPSC charge versus first-peak amplitude. (N) Datapoints are trials. Trials/SPNs/mice: IT, 423/26/10. PT, 1316/65/31. Lines: linear fits. Slope with 95% confidence interval (CI): IT, 15.64 pC/pA (15.03 to 16.25); PT, 17.8 pC/pA (17.11 to 18.48). Intersect with 95% CI: IT, 20.18 pC (−105.3 to 145.6); PT, 888.8 pC (790.2 to 987.4). (O) Datapoints are SPNs. SPNs/mice: IT, 26/10. PT, 65/31. (P) Examples of single (gray) and mean (IT, blue; PT, red) EPSCs from individual SPNs. (Q) Biphasic EPSC probability for individual neurons. SPNs/mice: IT, 26/10. PT, 65/31. (R) SPN responses to M1➔DLS PT axonal photostimulation. SPNs/mice: 8/4. (S) Single (gray) and mean (red) traces from the SPNs that showed biphasic M1➔DLS EPSCs.

