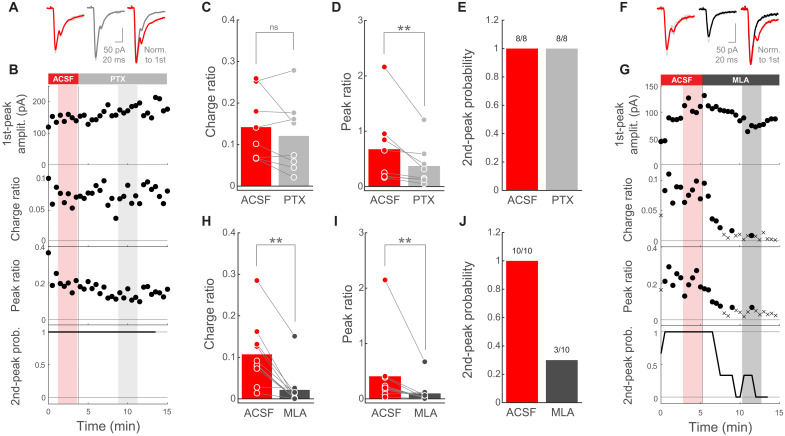
Fig. 2. Corticostriatal PT➔SPN EPSC second peak is mediated by striatal ChIs.
(A) Left: EPSCs from a representative SPN when photostimulating PT fibers in artificial cerebrospinal fluid (ACSF) (red) or PTX (gray). Right: Normalized mean traces. (B) Amplitude of the EPSC first-peak, charge ratio, peak ratio, and second-peak probability as a function of time, for the whole experiment in (A). Probability was calculated within a moving window of three consecutive trials. Shadowed areas highlight the individual trials averaged for each condition in (A). (C and D) Charge ratio and peak ratio for individual SPNs in ACSF and PTX. SPNs/mice: 8/5. P = 0.3125 (C); P = 0.0078125 (D); Wilcoxon signed-rank test. (E) Second-peak response probability for individual SPNs before and after PTX. SPNs/mice: 8/5. (F) Left: EPSCs from a representative SPN when photostimulating PT fibers in ACSF (red) or MLA (black). Right: Normalized mean traces. (G) EPSC metrics as a function of time for the whole experiment in (F). For charge and peak ratio: circles, EPSC with second peak; crosses, EPSC without second peak. Probability calculated as in (B). Shadowed areas highlight the trials averaged in (F). (H and I) Charge ratio and peak ratio for individual SPNs in ACSF and MLA. SPNs/mice: 10/7. P = 0.0019531 (H); P = 0.0058594 (I); Wilcoxon signed-rank test. (J) Second-peak response probability for individual SPNs before and after MLA. SPNs/mice: 10/7.

