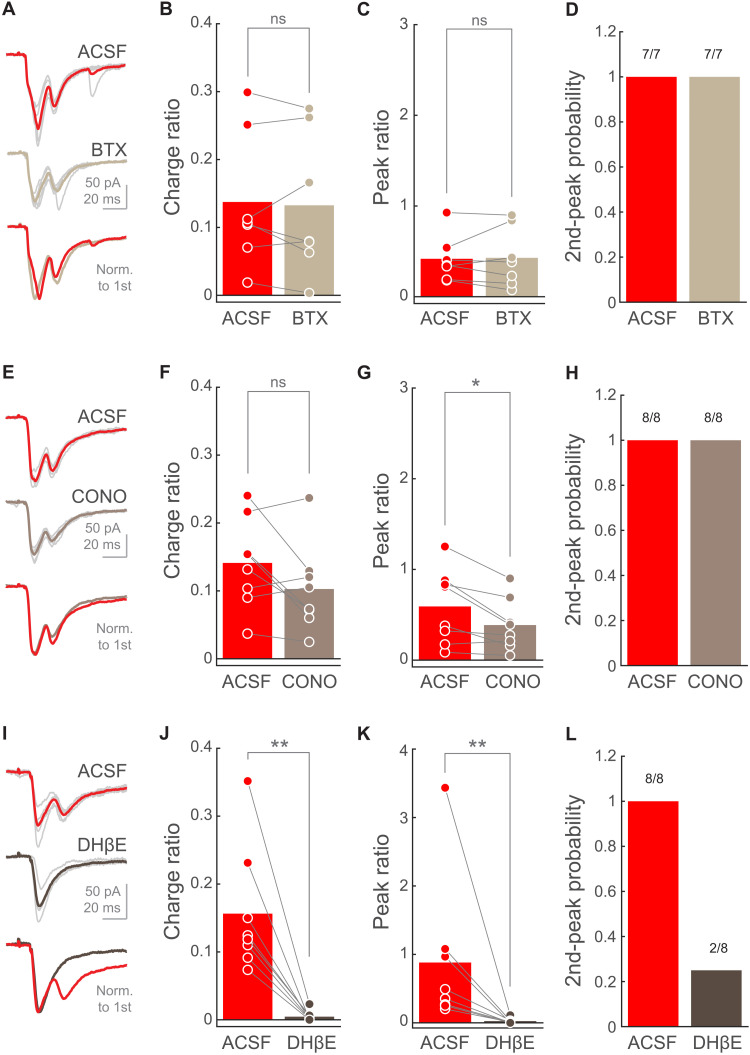
Fig. 4. PT➔SPN EPSC second peak requires α4-containing nicotinic receptor activation.
(A, E, and I) EPSCs from a representative SPN when photostimulating PT fibers in ACSF (top) or nicotinic blocker condition (middle). Thin light-gray traces are the five individual trials corresponding to the thicker mean traces. Bottom: Mean traces normalized to the first peak. (B, F, and J) Charge ratio for individual SPNs in ACSF or nicotinic blocker condition. BTX, n = 7 SPNs from three mice; CONO, n = 8 SPNs from three mice; DHβE, n = 8 SPNs from four mice. Bars represent means. P = 0.57813 (B); P = 0.25 (F); P = 0.0078125 (J); Wilcoxon signed-rank test. (C, G, and K) Peak ratio for individual SPNs in ACSF or nicotinic blocker condition. BTX, n = 7 SPNs from three mice; CONO, n = 8 SPNs from three mice; DHβE, n = 8 SPNs from four mice. Bars represent means. P = 0.6875 (C); P = 0.023438 (G); P = 0.0078125 (K); Wilcoxon signed-rank test. (D, H, and L) Second-peak response probability upon photostimulation of PT fibers for individual SPNs before and after the addition of the selective nicotinic antagonist. BTX, n = 7 SPNs from three mice; CONO, n = 8 SPNs from three mice; DHβE, n = 8 SPNs from four mice.

