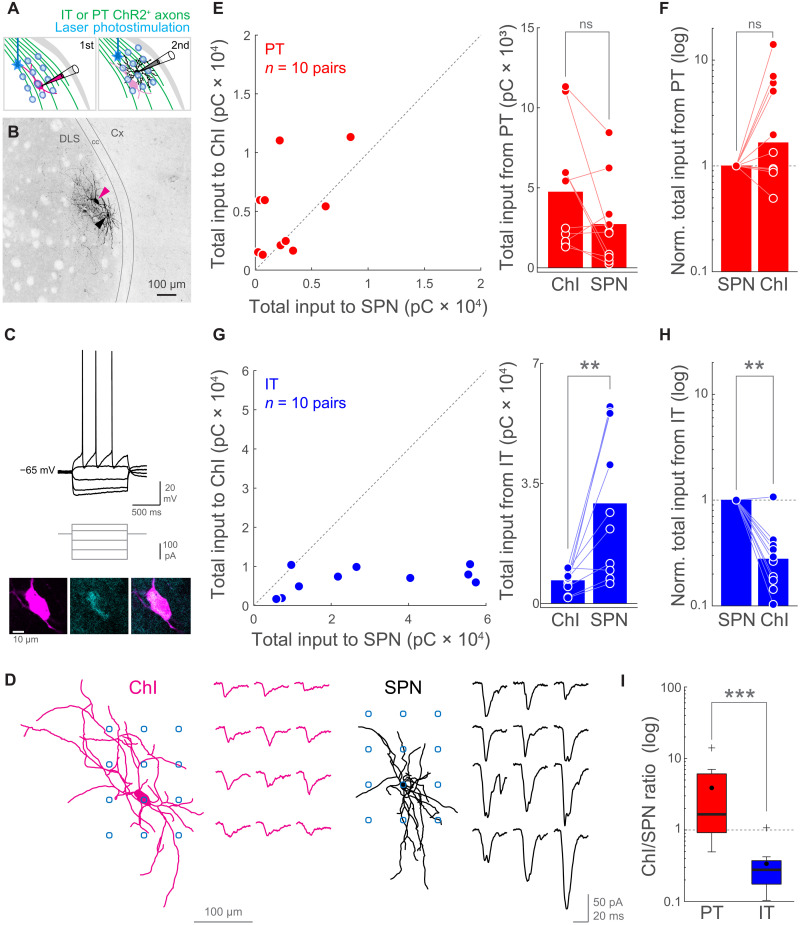
Fig. 5. PT neurons provide stronger relative inputs to ChIs than IT neurons.
(A) Experiment schematic. First, a ChI was recorded while IT- or PT-ChR2+ presynapses were photostimulated following a 3 × 4 grid pattern using a one-photon blue laser in TTX and 4-AP. Second, a neighboring SPN was recorded while photostimulating with the same pattern and identical illumination conditions. (B) Image showing a pair of biocytin-filled ChI (magenta arrowhead) and SPN (black arrowhead) from an IT-ChR2-EYFP mouse. (C) Top: Input-output curve of the ChI in (B). Middle: Current injection steps. Bottom: Confocal plane showing the soma of that ChI (left, magenta), its immunoreactivity to anti-ChAT antibodies (center, cyan), and both signals overlapped (right). (D) Reconstructions of the neurons in (B) with the relative position of their photostimulation grid (blue circles) and their correspondent matrix of IT➔ChI or IT➔SPN EPSCs. (E and G) Total input charge transferred to ChI-SPN pairs. Datapoints: left, pairs; right, neurons. PT: P = 0.16016; pairs/mice: 10/9; IT: P = 0.0039063; pairs/mice: 10/10. Wilcoxon signed-rank test. (F and H) Normalized total input to ChI-SPN pairs. Bars represent medians. PT➔SPN versus PT➔ChI, P = 0.10547; pairs/mice: 10/9. IT➔SPN versus IT➔ChI, P = 0.0039063; pairs/mice: 10/10. Wilcoxon signed-rank test. (I) Box plot comparing the normalized input to ChIs (ChI/SPN ratio) from PT and IT. P = 0.00058284; Wilcoxon rank sum test, z = 3.44. Pairs/mice: PT, 10/9; IT, 10/10. Horizontal line, median; black circle, mean; box edges, 25th/75th percentile; whiskers, maximum and minimum excluding outliers; crosses, outliers.

