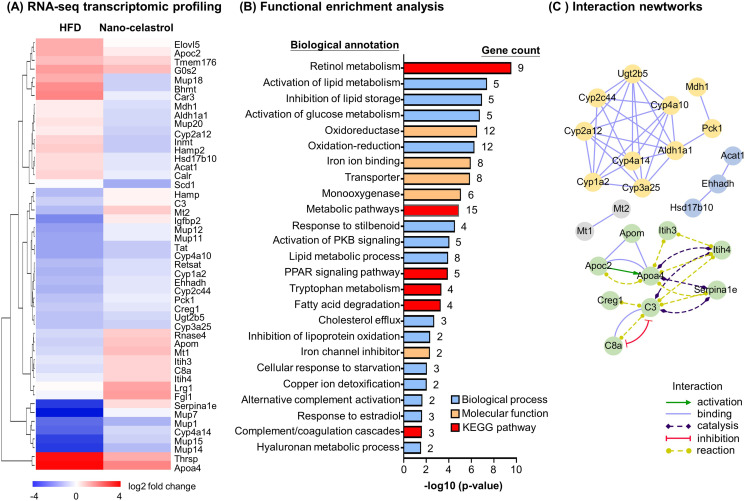
Figure 4. RNA-seq transcriptome profiling of celastrol-regulated genes.
(A) Hierarchical cluster analysis of celastrol-regulated differentially expressed genes (DEGs) in high-fat diet (HFD)-induced obese mice. Expression values are determined by next-generation RNA-seq technology on Illumina HiSeq2500 platform (https://www.genomics.cn/). Data were presented as the expression values (log2 fold change) of the genes in HFD group and HFD + Nano-celastrol group relative to that in Control group. Increases in log2 fold of change are indicated in red hues while decreases are in blue hues. (B) Functional enrichment analysis of celastrol-regulated DEGs. Celastrol-regulated DEGs were classified into different functional groups in terms of molecular function, biological process, and Kyoto Encyclopedia of Genes and Genomes (KEGG) pathway using online DAVID v6.8. The number of genes related to each term was shown next to the bar. (C) Protein–protein interaction networks of the DEGs. Protein–protein interactions were analyzed by online STRING tool. The interaction networks involving DEGs were represented in different colors and lines using Cytoscape.

