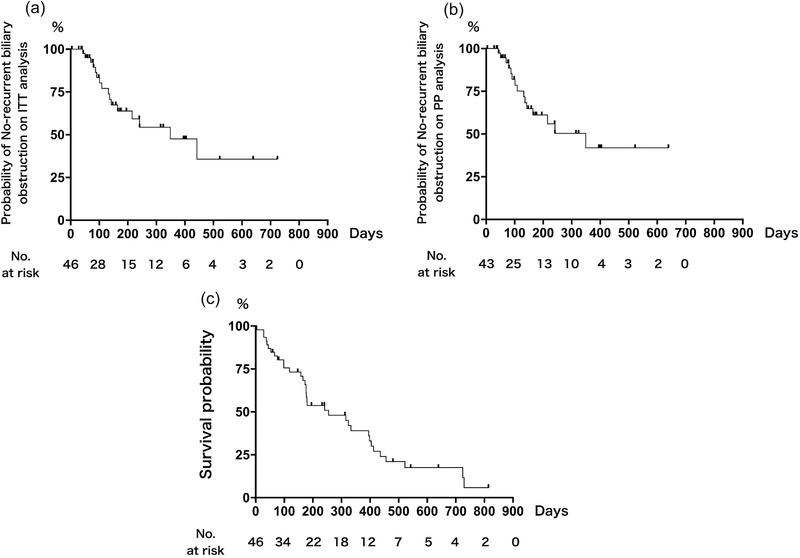
FIGURE 3.

Kaplan‐Meier curves for (a) time to recurrent biliary obstruction on intention‐to‐treat analysis, (b) per‐protocol analysis, and (c) patient survival

Kaplan‐Meier curves for (a) time to recurrent biliary obstruction on intention‐to‐treat analysis, (b) per‐protocol analysis, and (c) patient survival