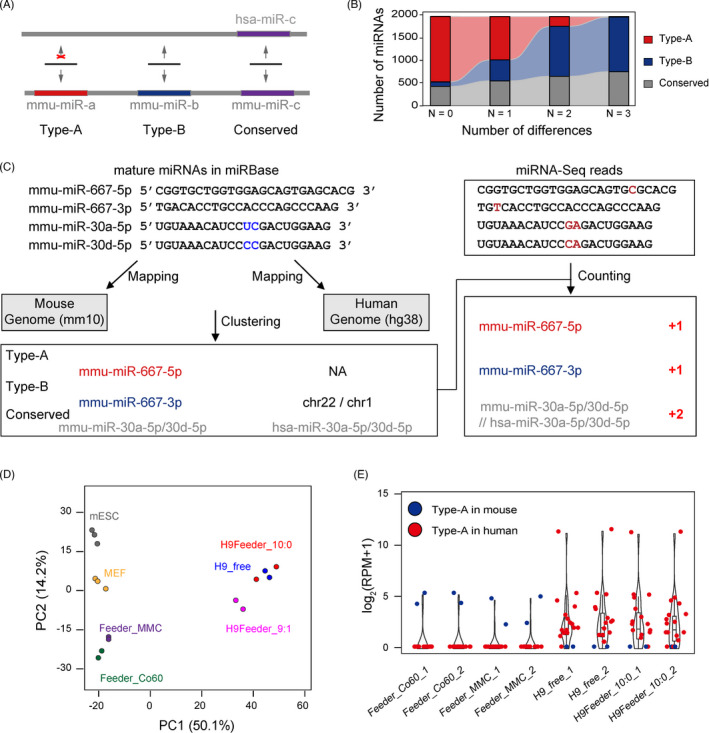
FIGURE 2.

Identification of feeder cell‐specific miRNAs. (A) Schematic diagram showing the definition of miRNA types based on the alignment of mouse miRNAs to the human genome. (B) Distribution of mouse miRNA types that were mapped to the human genome with a specific distance setting. (C) Strategy for the annotation of miRNA clustering and miRNA quantification. (D) Principal component analysis (PCA) of miRNA expression profiles based on the established counting strategy. The percentages of variation explained by the principal components are marked in brackets. H9Feeder_9:1 means mixed H9hESCs and feeder cells with a 9:1 ratio. (E) Expression level of Type‐A miRNAs or miRNA clusters in feeder cells, H9hESCs cultured in a feeder‐free system, and H9hESCs cultured in a feeder system isolated by FACS. The miRNA expression level (RPM) was normalized by log2
