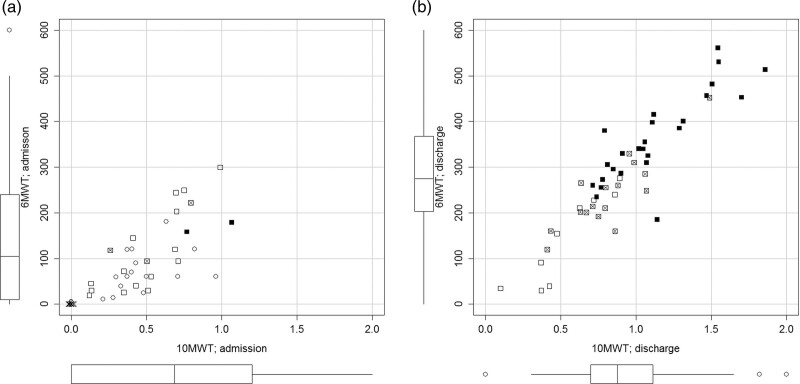
Fig. 1.
Scatter plot of 6-Minute Walk test (6MinWT) and Timed 10-Metre Walk Test (10MWT) at admission (a, left) and discharge (b, right). Boxplots on the margins indicate the group results for 10 MWT (horizontal axis) and 6 MinWT (vertical axis). Different symbols denote the ambulatory status and the use of walking aids (crosses, does not walk, circles, forearm walker, empty square, walking frame or rollator, crossed square, crutches, black square, no walking aid).

