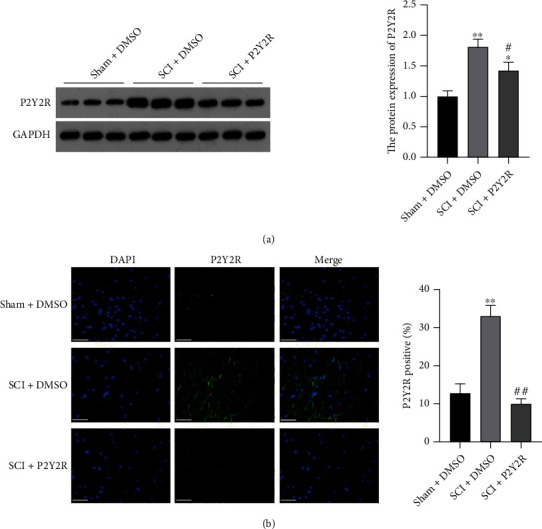
Figure 1.

(a) The expression level of P2Y2R in spinal cord tissue detected by western blot. (b) The expression level of P2Y2R in spinal cord tissue detected by immunofluorescence staining. Scale bar = 50 μm. ∗p < 0.05 and ∗∗p < 0.01 compared with the sham+DMSO group; #p < 0.05 and ##p < 0.01 compared with the SCI+DMSO group.
