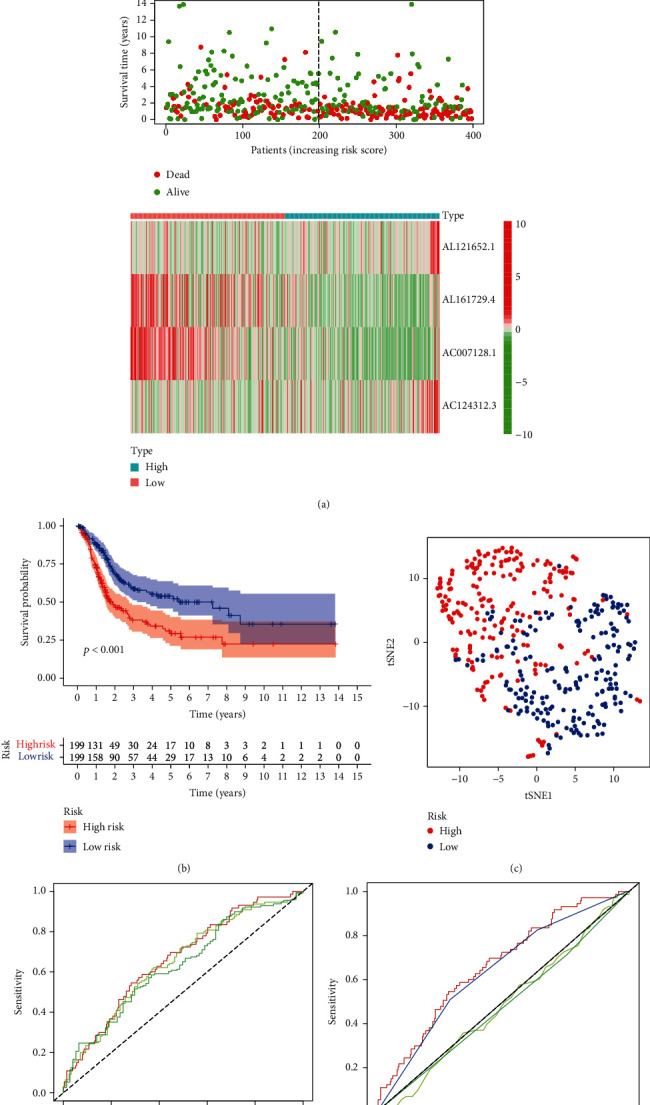
Figure 2.

Evaluation of the pyroptosis-related lncRNA prognostic model for bladder cancer. (a) The risk curve consisted of risk scores in each sample, according to our prognostic risk model. The scatterplot consisted of survival status in each sample. The green dots represent alive, while the red dots represent dead. The heat map shows the expression levels of 4 pyroptosis-related lncRNAs in the low-risk group and high-risk group. (b) Kaplan–Meier survival analysis indicated that the survival time of bladder cancer patients in the high-risk group based on the pyroptosis-related lncRNA prognostic model was markedly shorter than that in the low-risk group. (c) t-SNE (t-distributed stochastic neighbor embedding) based on four pyroptosis-related lncRNAs showed two distinct distribution modes between the low- and high-risk groups. (d) The ROC curve indicated that the AUCs for 1-year, 2-year, and 3-year overall survival predicted were 0.663, 0.649, and 0.632, respectively. (e) The ROC curve showed that the pyroptosis-related lncRNA prognostic model was better than other predictive indicators, such as age, sex, and stage.
