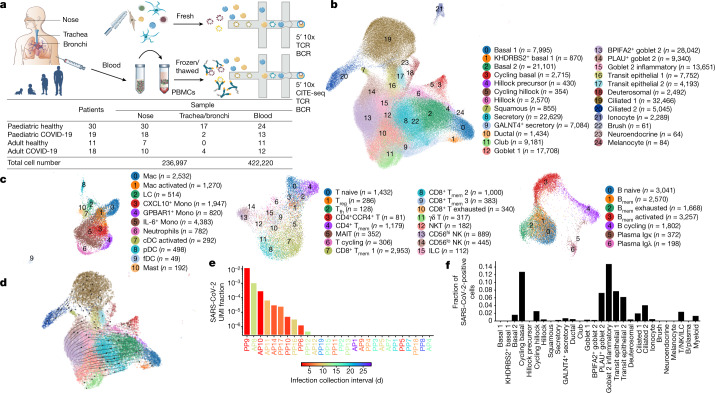
Fig. 1. Experimental outline and overview of results.
a, Visual overview of the experimental design, numbers of patients, samples taken and single cells sequenced. b, c, Uniform manifold approximation and projection (UMAP) visualization of annotated airway epithelial cells (b) and immune cells (c), with the cell numbers per cell type shown in parentheses. Bmem, memory B cells; cDCs, conventional dendritic cells; fDCs, follicular dendritic cells; ILCs, innate lymphoid cells; LCs, Langerhans cells; Mac, macrophages; MAIT, mucosal-associated invariant T cells; Mono, monocytes; NKT, natural killer T cells; pDCs, plasmacytoid dendritic cells; Tfh, T follicular helper cells; Tmem, memory T cells; Treg, regulatory T cells. A full list of abbreviations is provided in the Supplementary Note. d, Airway epithelial cells in the same UMAP as a with RNA velocity of major epithelial cell types. e, The fraction of SARS-CoV-2 viral unique molecular identifiers (UMI) (where ≥10 were detected per donor) relative to total UMI per donor, before filtering out of ambient RNA, in descending order coloured by infection collection interval (days). This was calculated as the days between sample collection and estimated onset of infection, based on the first symptom onset or a positive SARS-CoV-2 RT–qPCR test, whichever was reported first for symptomatic patients, and the latter for asymptomatic patients. f, The fraction of airway cells with detected SARS-CoV2 mRNA in each cell type (with immune cells in broad categories) in patients with COVID-19 with detected viral RNA (≥5 viral UMI per donor following filtering out ambient RNA). n = 9.

