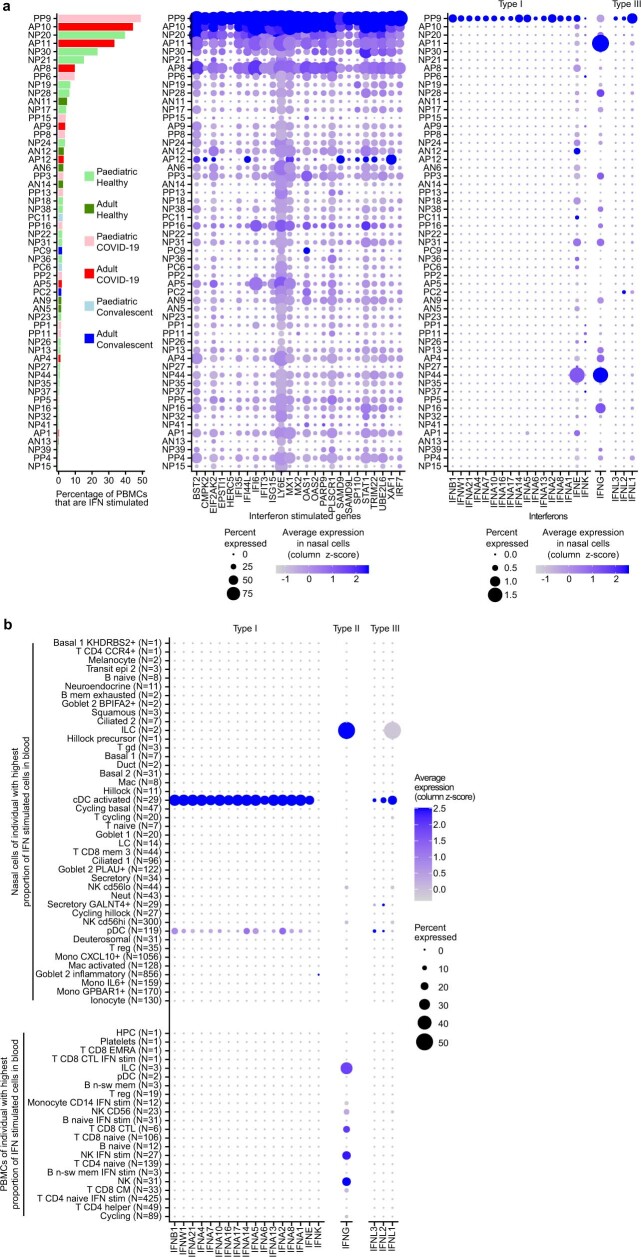
Extended Data Fig. 8. Interferon expression in COVID-19 patient with highest amount of interferon-stimulated blood cells.
(a) Ranked barplot and matched dotplots as in Fig. 3h, but showing the expression of all genes that make up the interferon-stimulated gene signature (middle) and the expression of all interferons (right) in all cells, instead of averaged signatures gene expression signatures in specific cell types. (b) Dotplot related to Fig. 3h showing the expression of all interferons in all nasal resident (top) and circulating (bottom) cell types that were present in this individual. The size of the dot is scaled to the percentage of cells that have at least one count for each gene or protein, and the colour is scaled to the z-score normalized expression of each gene or protein.

