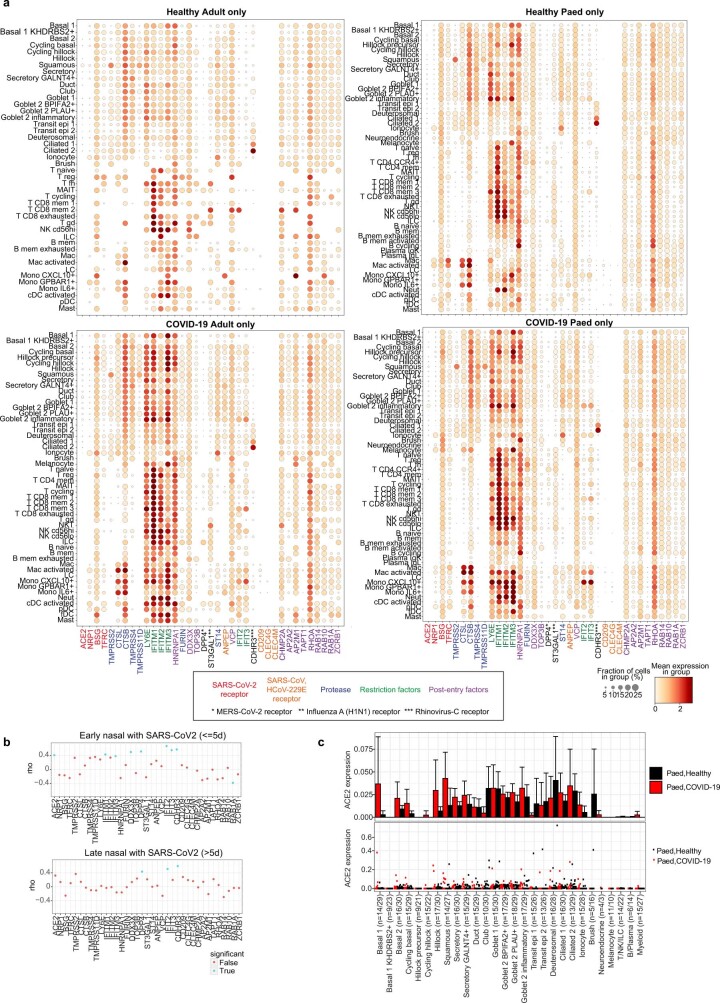
Extended Data Fig. 4. Expression of viral entry-associated genes in the airways.
(a) Dot plots showing cell type expression of viral entry-associated genes within the upper airways of healthy adults (n = 7), healthy children (n = 30), COVID-19 adults (n = 10) and COVID-19 children (n = 18) respectively, included genes linked to SARS-CoV-2, SARS-CoV, MERS-CoV, Rhinovirus-C and Influenza A infections. The fraction of expressing cells and average expression within each cell type is indicated by dot size and colour, respectively. (b) Spearman correlation between the fraction of cells with detected viral RNA and the average expression of entry factors, as in (a), across cell types within the airways of COVID-19 patients samples (with viral reads ≥ 5) within 5 days of a positive SARS-CoV-2 qPCR test (Early) and those sampled longer than 5 days prior to onset of symptoms or positive SARS-CoV-2 qPCR test, whichever was longer (Late). Dots in blue indicate p < 0.05. (c) Expression of ACE2 in paediatric airway cells in each cell type averaged by donor (upper) and in each donor (lower) and coloured by COVID-19 status. Error bars indicate two times standard error of the mean across donors. Numbers in brackets indicate numbers of COVID-19 donors/healthy donors.

