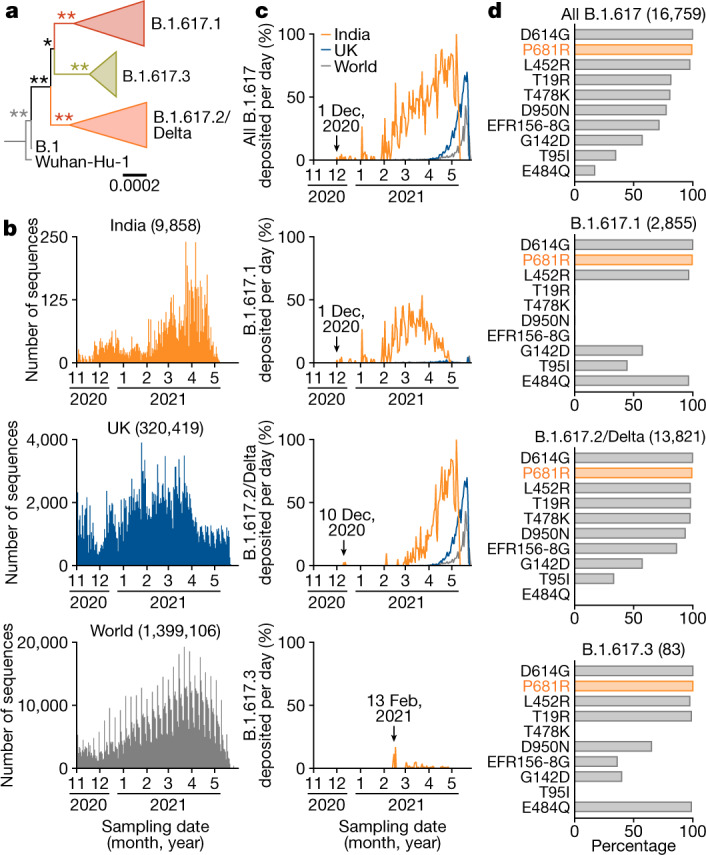
Fig. 1. Molecular phylogenetics and epidemic dynamics of the B.1.617 lineage pandemic.

a, Phylogenetic tree of the B.1.617 lineage. Scale bar, 0.0002 substitutions per site. Bootstrap values are indicated by asterisks; **100%, *>70%. The uncollapsed tree is shown in Extended Data Fig. 1. b, c, Epidemic dynamics of the B.1.617 lineage. b, The number of sequences deposited in GISAID per day for India (top), the UK (middle) and the world (bottom). c, The percentages of each lineage deposited per day from India (orange), the UK (blue) and the world (grey). The date on which each variant was first identified is indicated. The raw data are summarized in Supplementary Table 1. d, The proportion of amino acid replacements in the B.1.617 lineage. The top 10 replacements conserved in the S protein of B.1.617 and its sublineages are summarized. The numbers in parentheses indicate the number of sequences included in each panel. The raw data are summarized in Supplementary Table 2.
